Key Global Equity Index Back On The Precipice

An index that tracks the world’s largest stocks is testing its post-2009 uptrend…again.
The “markets move at random” crowd generally has a difficult time with our posts wherein we lay out price movement scenarios based upon charting analyses. Any reluctant concessions on their part typically center around the “self-fulfilling prophesy” notion. That is, technical analysis only works because so many market participants are watching the same chart levels that their effectiveness is “self-fulfilling”. We disagree. We don’t think it’s that easy. If everyone is watching the same levels, and they work, then everyone is winning. We all know that’s not a market reality.
In fact, we have found an inverse relationship between the popularity of a
technical analysis tool, a chart level or even a security itself and the effectiveness in their exploitation. In our experience, obscure securities – or even price plots that nobody trades at all – are more conforming to technical tools. That idea really confounds the “random crowd”. As an example, we offer up the Global Dow Index.
As a refresher, the Global Dow is an unweighted average of 150 of the world’s largest companies. And although there is naturally a massive amount of money traded in its components, there is very little money directly tied to the index itself. So what possible reason would there be for the index to “respect” key technical levels on its chart? We have no idea – it just does. And while that reason may be wholly inadequate for the random crowd, it’s plenty satisfactory for us.
Whatever the reason, the Global Dow has conformed to technical chart levels very closely over the past 6 months. In fact, it has been very useful in helping us navigate the global equity landscape over that time. Consider its track record.
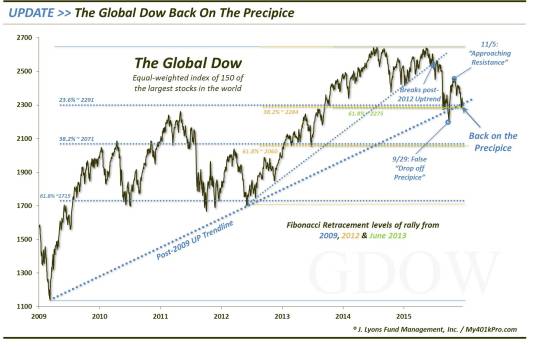
In mid-June, we noted that the Global Dow was testing the Up trendline on its chart that extended from the 2012 low. Why would an index that essentially nobody trades form a trendline stretching over a 3 year period with at least 5 separate precise touches? We aren’t sure, but it did. The index again bounced following the June post after another precise kiss of the trendline. Even more helpful was observing the break of the trendline 2 weeks later, setting the stage for global equity weakness later in the summer.
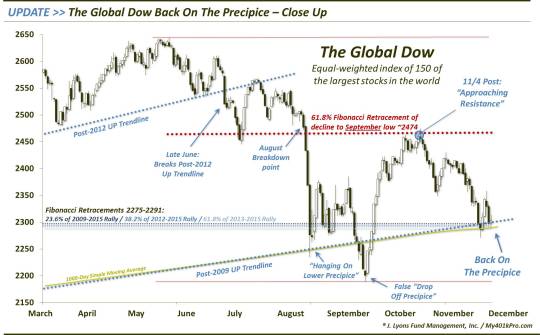
At the lows in late August/early September, the Global Dow found itself testing another Up trendline: the one extending from the 2009 low up through the 2012 low. Now, with nobody really trading the index, why would it respect this trendline either? We’ve no idea, but it did again. Furthermore, the following major confluence of Fibonacci Retracement levels lined up in the same vicinity as the trendline. If you want to call the index’s exact bounce off these levels a random occurrence, so be it. It was actually very instructive to us.
- The 23.6% Fibonacci Retracement of the 2009-2014 Rally ~2291
- The 38.2% Fibonacci Retracement of the 2011-2014 Rally ~2284
- The 61.8% Fibonacci Retracement of the June 2013-2014 Rally ~2275
Well, the bounce lasted for about a month. During the re-test of the initial low, the Global Dow broke down below its post-2009 Up trendline, a development we noted with serious concern on September 29. Of course, that day turned out to be the low for the correction as the index, and stocks worldwide, turned around and rallied from that point. Despite the “false breakdown”, we don’t necessarily consider this a failure of the chart levels. False breakouts and breakdowns occur all the time. The ability of price to quickly recapture the trendline can be just as instructive as the breakdown. Indeed, we considered it a very positive sign in this case.
The most recent post on the technical travels of Global Dow perhaps did not contain quite as significant a level as the prior examples. Nevertheless, the behavior of the index did nothing to detract from its stellar run of adherence to key charting points. On November 5, we noted that, following over a month-long rally, the Global Dow was encountering resistance. Now, did we know the high for the post-September rally in the index would end up occurring on November 4? No, but the chart gave us some good hints in that regard – certainly much better than random.
Fast forwarding to the present, we see that the Global Dow is now back on its post-2009 Up trendline, not to mention the vicinity of the key Fibonacci cluster as well still. Here is the chart, also showing some of the key junctures mentioned above.
Here is a close-up look at the past 6 months.
What’s the point? From a philosophical standpoint, if you have never considered the possibility that price movements have very little to do with random occurrences based on fundamental data and a whole lot to do with supply and demand, investor psychology and technical price structure, we would urge you to re-consider. Even an index like the Global Dow, which has next to nothing in the way of money tied to its movement, has shown a strong tendency to adhere to key technical levels on its chart.
Importantly, from a technical standpoint, the Global Dow is presently sitting on top of its post-2009 Up trendline as well as a major cluster of Fibonacci Retracement levels. We’ve said that when we see an increase in the frequency of tests of a trendline or other key level, the likelihood of the level breaking increases. That is what we have been seeing recently. Therefore, while the trendline may be able to support another bounce (in conjunction with a year-end equity rally?), we see increasing risk that the trendline will break. If that occurs, the next significant support on the chart is over 10% below current prices.
Then again, if you think it’s all random, carry on.
________
“World on knife edge” photo by ChazGoes.
More from Dana Lyons, JLFMI and My401kPro.
The commentary included in this blog is provided for informational purposes only. It does not constitute a recommendation to invest in any specific investment product or service. Proper due diligence should be performed before investing in any investment vehicle. There is a risk of loss involved in all investments.


