Complacent Correction Cause For Concern?

Despite recent stock market carnage, the reaction by the VIX has been a relative yawner.
Well, the New Year hangover continues. Another day, another drubbing in the stock market. With indices pushing double digit losses just 8 days into the new year, it certainly seems reasonable to expect some panic on the part of investors. However, at least based on one metric, market participants have remained relatively calm – even unprecedentedly so.
The metric we are referring to is the VIX, or the Volatility Index on the S&P 500. The VIX, a.k.a., the “Fear Gauge”, measures the expected volatility of the index. During times of crisis, or even a garden variety stock market decline, one can expect the VIX to rise. That has indeed been the case during the current stock weakness. However, based on the magnitude of the S&P 500′s decline, the VIX has risen by a historically small amount.
Specifically, the S&P 500 has now dropped over 9% in the past 2 weeks. Despite that, the VIX has risen to just 25.22. Since 1987 (the VIX’ inception was in 1986), there have been 129 days on which the S&P 500 was down as much as 7% over the past 2 weeks. Today’s VIX reading is the lowest of any of those days.
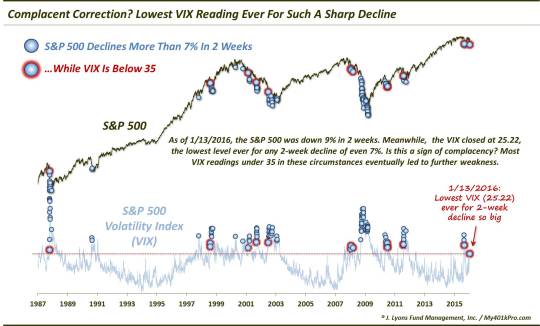
So what gives? Is this a sign of relative complacency despite the sharp market losses? That is a reasonable thesis, especially upon quantitative examination. Looking at the prior 128 days that showed a 2-week S&P 500 decline of at least 7%, just 15 had a VIX reading of less than 34. Now, this 34 level is an arbitrary number, but it seems about as good a delineating level as any. Here are the previous days matching those conditions:
10/15/1987
8/4/1998
8/5/1998
2/21/2001
9/10/2001
7/2/2002
1/17/2008
1/22/2008
3/10/2008
7/1/2010
7/2/2010
7/6/2010
8/4/2011
8/5/2011
9/1/2015
In general, these occurrences led to further weakness in stocks. Indeed, despite the big drop already, these conditions often marked a point closer to the beginning of a decline than an ending. Whether it was immediately (e.g., the crash in 1987, September 2001 or early August 2011) or a few weeks and months later, further weakness was the norm. The 2010 dates really represent the exception as the market would rebound immediately. Excluding that period, however, here are some statistic on the S&P 500′s performance going forward.
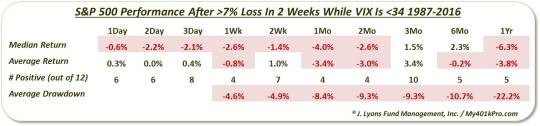
As you can see, the results don’t paint a very rosy picture, despite the fact that the S&P 500 has already taken its licks. So does the “complacency” explanation hold water here. We’re not sure – nor do we really care. All we really care about are the cold, hard numbers. And if history is any guide, investors, who have demonstrated a rather complacent reaction to the decline so far, may very well get a wake up call before this slump has run its course.
________
More from Dana Lyons, JLFMI and My401kPro.
The commentary included in this blog is provided for informational purposes only. It does not constitute a recommendation to invest in any specific investment product or service. Proper due diligence should be performed before investing in any investment vehicle. There is a risk of loss involved in all investments.

