European Stocks Set To Plunge Lower?
Exactly one year after breaking out to multi-year highs, European equities are breaking down from similar levels.
What a difference a year makes. Exactly one year ago, European stock markets (or do I have to call them bourses?) were launching a breakout to new multi-year or all-time highs. On January 20, 2015, we wrote a post titled “European Stocks Set To Blast Higher?” detailing the attractiveness of the breakout (by the way, we realize the redundancy of the current title “Plunge Lower”…however, you see it was chosen for symmetry reasons). Here is one of the charts we referenced in that post on the broad continent-wide STOXX Europe 600 Index.
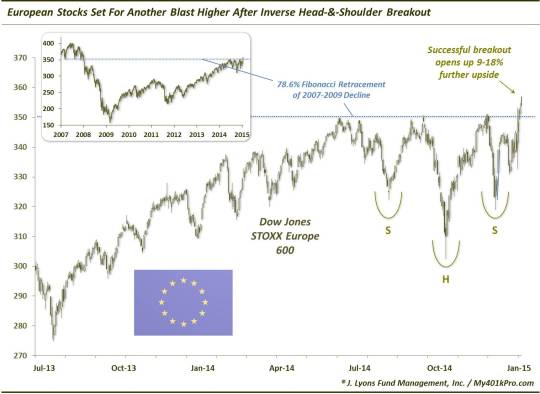
Note how the index, like many others across Europe, broke above a 6-month triple top with the kicker being an inverted head-and-shoulders pattern. Lastly, the 78.6% Fibonacci Retracement of the 2007-2009 decline was in the same area. So, the potential breakout had a lot going for it. And it delivered.
Based on Fibonacci analysis and the inverse H-&-S pattern, we projected anywhere from 9-18% upside following the breakout, using the STOXX Europe 600. The 18% rise would bring the index to its 2000 all-time high (just above the 2007 high). As it turns out, the index rallied exactly 18% into April, before a not unexpected pause took place.
In June-July, after a nice, orderly pullback, we thought that European stocks may be ready to begin the next leg up of its post-breakout advance as they were hitting key Fibonacci Retracements. In mid-July, the bullish scenario remained “On Course”, as we outlined in a post. Immediately, European stocks began to bounce, close to 10% by most gauges. However, that was as high as the rally would go as the European rocket began to lose fuel.
In the late-August global stock rout, European stocks dropped all the way back to the January breakout level. While it was dicey at the time, that level held eventually, as we surmised it likely would. However, after failing at key resistance in November, European stocks came into 2016 testing their breakout levels from a year earlier once again.
That brings us to the current, less-optimistic set of circumstances than existed exactly one year ago. Just this week, stock markets across Europe have begun to break down below their breakout levels of last January. That includes the STOXX 600.
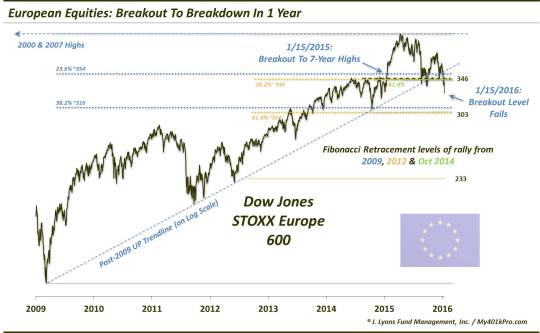
This breakdown is a big deal. As they say, from failed moves come fast moves (i.e., in the opposite direction). In other words, when a breakout cannot hold (especially one as textbook as this one), that is substantial evidence that prices are likely to move forcefully in the other direction. That is the risk now.
And the risk isn’t just because of the failed breakout point. As is often the case with financial markets, there are other symmetries on the STOXX 600 chart which line up in the vicinity of the breakout point. These include key Fibonacci Retracements from the 2009, 2012 and 2014 lows, as well as the post-2009 Up trendline (on a log scale). The fact that these analyses all line up in the same area only emphasize the importance of this level – and the risks involved with its breaking.
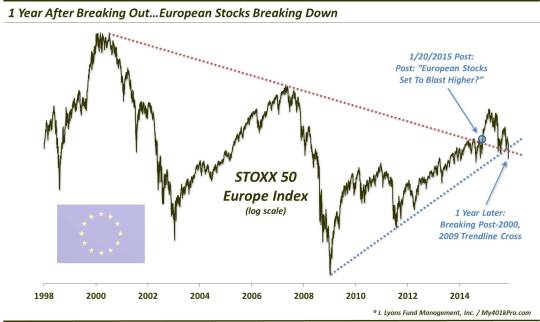
Another index – the larger-cap, more concentrated STOXX 50 Europe Index – is suffering a similar breakdown now. It also offers its own unique, interesting set of circumstances. Its breakout last January also corresponded with a breakout above the post-2000 Down trendline, connecting the 2007 top (also on a log scale). Now, the STOXX 50 breakdown includes a break below that falling trendline. Furthermore, the index is simultaneously breaking down below its post-2009 Up trendline. This is not good.
We have long thought the economic situation in Europe is a mess (not that we’re unique in that thinking). However, as money managers, we have to divorce ourselves from that view and focus on the attractiveness of the market as determined by the direction and character of the price structure. One year ago today, despite the bleak economic situation, the near-term stock investment landscape in Europe looked about as bright as it gets. One year later, however, the investment prospects have completely reversed, and appear to be more in line with the dismal fiscal reality.
________
“Euro Man” photo by Rock Cohen.
More from Dana Lyons, JLFMI and My401kPro.
The commentary included in this blog is provided for informational purposes only. It does not constitute a recommendation to invest in any specific investment product or service. Proper due diligence should be performed before investing in any investment vehicle. There is a risk of loss involved in all investments.