Will Record January Stock Volatility Produce Long-Term Tremors?

The stock market has seen more big moves in 2016 than any other January in history; other volatile January’s have often come near market tops.
You may be familiar with the concept of the “January Barometer”. While there are different versions, they all fall under the same premise: as goes the first day or week or full month of January, so goes the rest of the year. Earlier this month, we looked into this indicator to some degree, given the historically poor start to the year in the stock market. Certainly none of these seasonal patterns work every time. However, from what we’ve observed, there does seem to be some degree of truth to the tendency of the stock market to follow its early January direction over the rest of the year.
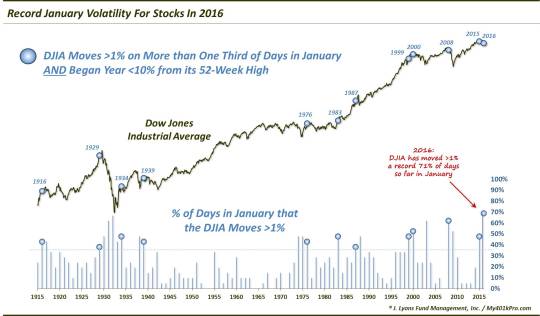
Besides a historically weak start to the year, we are also witnessing a historically volatile start to the year. This is not terribly surprising, given that volatility is typically part and parcel of weak markets. But by one measure, we are seeing THE most volatile January in U.S. market history. Through today, there have been 17 trading days in January. Based on the Dow Jones Industrial Average (DJIA), 12 of them have seen moves of at least 1%, up or down. At 71%, this marks the highest percentage of January days seeing moves of at least 1% in history.
Given this development, we wondered if there was perhaps a January Barometer based on volatility as opposed to just weakness. Again, they tend to go hand-in-hand so there is not surprisingly some overlap. However, we took a look at all January’s over the past 100 years that exhibited a high level of volatility, as measured by an elevated number of 1% days. Since 71% is unprecedented, we had to relax the parameters a bit to find other years in the sample. So we arbitrarily picked January’s with over one third, or 33%, of their days moving at least 1%. This netted us 22 years prior to 2016 in the past 100 years.
Some of these years, not surprisingly, occurred after sustained bear markets had already driven stocks down some 20%, 30% or even as much as 60% off of their highs before January even got started. Again, such volatility is commonplace within the depths of bear markets, such as in the January’s of 2009, 2003, 1974-75 and the early 1930′s. As comparisons to our present situation, however, those years don’t seem to fit the bill.
So, of the original 22, we looked at just those years when January began with the DJIA within 10% of its 52-week high (this year began with the DJIA just less than 5% from its 52-week high). Such high volatility within arm’s length of a 52-week high is less conventional and probably serves to be a bit more instructive to our present situation. That stipulation weeded out half of the results and left us with the following 11 years:
1916
1929
1934
1939
1976
1983
1987
1999
2000
2008
2015
Now, if you know anything about your market history, that list of years may jump out at you – and not in a bullish way. Here they are on a chart.
First of all, 9 of the 11 occurred within the confines of a secular bear market (FYI, our view is that the market is still likely in the post-2000 secular bear so we are including 2015 in that category). Only 1983 and 1987 took place in a secular bull. And while the market fared just fine in the years following those two, 1987 did bring a little surprise later in the year. All in all, however, these volatile January’s that occurred relatively close to the DJIA’s highs did not lead to very attractive returns over the long-term.
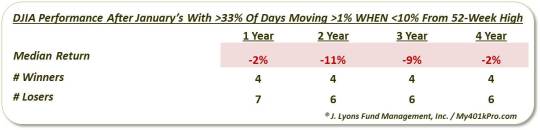
Including the 2 occurrences in the 1980′s, a majority of these precedents showed negative returns as far out as 4 years. Yes, this study has involved a fair bit of data-mining, however, it is still difficult to run tests that produce results showing median 4-year returns in the red.
Is it a coincidence that so many of these volatile January’s coming just off of 52-week highs occurred during secular bear markets? We don’t know but we generally don’t believe in coincidences in the markets. Regardless, a large percentage of these previous occurrences very closely marked cyclical tops within those secular bear markets. If we are indeed still within the confines of the post-2000 secular bear market, the volatile January to begin 2016 would seem to bear the threat of another cyclical market top – and perhaps market tremors for some time to come.
________
More from Dana Lyons, JLFMI and My401kPro.
The commentary included in this blog is provided for informational purposes only. It does not constitute a recommendation to invest in any specific investment product or service. Proper due diligence should be performed before investing in any investment vehicle. There is a risk of loss involved in all investments.


