Brazil’s Bovespa Is Once Again…The Most Interesting Chart In The World

After resolving its former “most interesting” chart status with a massive breakdown in January, Brazil’s Bovespa is back testing that breakdown level in an equally interesting development.
On September 4 of last year, we labeled the Brazilian Bovespa stock index “The Most Interesting Chart In The World”. You’ll recall that, at the time, global equity markets were knee deep in one of those “markets in turmoil” phases, to borrow a term from alarmist financial television. Thus, to be granted such a title, the Bovespa must have been a real doozy. Well, we’re chart geeks, but we thought it was special.
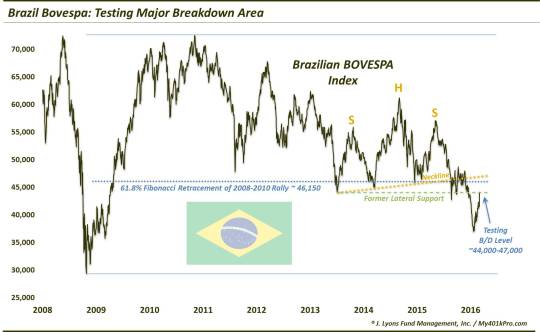
Specifically, at the time the Bovespa was involved in an epic bull/bear battle, pitting the following chart forces against one another:
- In The Bull Corner: the 61.8% Fibonacci Retracement of the Bovespa’s 2008-2010 rally around 46,150, which the index held a half dozen times over the prior half decade.
-
In The Bear Corner: a potential massive head-&-shoulder pattern formed over the prior 2 years, with the the 61.8% Fibonacci touches serving as the neckline.
Which scenario would be victorious in this epic, and interesting, battle? We had no idea. As I told many people: “I’m confident it is going to move BIG…I just don’t know which way yet.” The irony was that, in the post’s aftermath, the Bovespa trodded along the line of bull/bear demarcation for nearly 4 months, refusing to reveal its grand decision. Thus, for 4 months, the Bovespa transformed into essentially the least interesting chart in the world.
Then things got interesting again. On the first day of 2016, the Bovespa broke, and broke hard as we suspected it eventually would. It lost 3% on that first day and wouldn’t look back. By 3 weeks in, it was down over 14% for the year. Things looked hopeless for the Bovespa.
Then another interesting thing happened. The index bounced – and has continued to bounce up through today’s action. Now, just about 5 weeks after hitting its -14% YTD rock bottom, the Brazilian Bovespa is actually up for the year.
This is where it gets “most interesting chart in the world” type of interesting again. The Bovespa is now testing the lower bounds of its massive head-&-shoulders/Fibonacci breakdown level that marked the chart’s “most interesting” status in the first place.
Here it is up close:
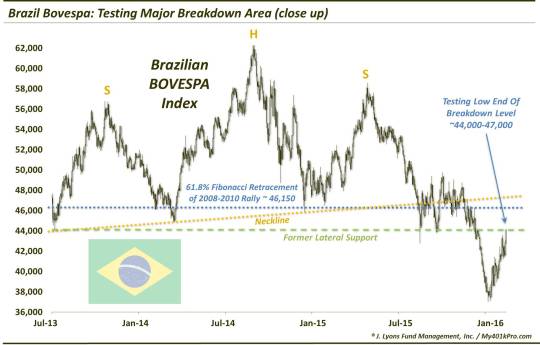
What makes the chart so interesting now? It is essentially setting up a similar scenario as in September, i.e., a likely very large move – in either direction. The previous setup involved either a substantial up-move off of massive, multi-year support – or a substantial drop should that support fail to hold, with the added pressure of a multi-year head-&-shoulders pattern. Well, the head-&-shoulders scenario won out, as we mentioned, leading to that immediate 14% plunge to begin the year.
Now, the scenario revolves around the confirmation, or rejection, of that massive head-&-shoulders breakdown. Either of the 2 outcomes could, again, have monumental consequences and entail substantial moves as a result.
A confirmation of the breakdown (i.e,, this area acts as resistance) should lead to another large decline, and very likely lower lows than those seen in January. Conversely, a rejection of the breakdown (i.e., price rises above the breakdown zone), would constitute a false breakdown. False breakdowns often lead to up moves every bit as powerful as the potential breakdown would have been. Considering the magnitude of support and the scale of the head-&-shoulders formation that was broken, should it turn out to be a false breakdown, the potential upside probably could not be overstated.
So what level should we key on to instruct us as to which scenario wins? No level should ever be taken as gospel, so we are considering a range of potential levels that could encompass the Bovespa’s “test” of its breakdown. That range would essentially extend from former lateral support around 44,000, which the index is testing today, up to the diagonal extension of the hypothetical head-&-shoulders neckline, currently just above 47,000. The reaction at this area could set the tone of the Brazilian stock market for the next several months, or possibly even years to come.
We don’t always focus on Brazilian stocks; but when we do, we prefer dos posiblementes grandes.
_______
More from Dana Lyons, JLFMI and My401kPro.
The commentary included in this blog is provided for informational purposes only. It does not constitute a recommendation to invest in any specific investment product or service. Proper due diligence should be performed before investing in any investment vehicle. There is a risk of loss involved in all investments.