Calmer Days Ahead For Oil Prices?
The Oil Volatility Index convincingly broke below its post-2014 Up trendline today; that
could
mean less volatility ahead for oil prices.
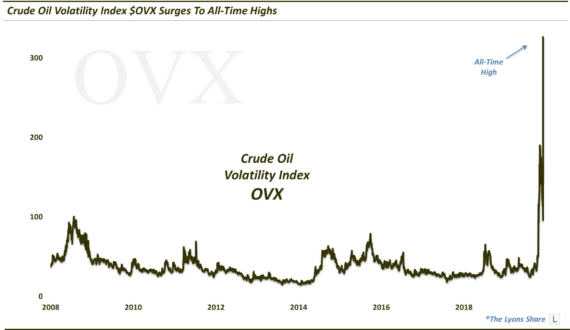
Volatility indexes have become increasingly accessible and popular in recent years. These are measures of the options market’s expectations for future volatility in the underlying asset. In most markets, the volatility index rises when the underlying falls, indicating an increased expectation of volatility. That’s why these volatility indexes have become known as “fear gauges”. The most well known volatility index is the S&P 500 Volatility Index, better known as the “VIX”. However, there are now volatility indexes covering a wide array of markets, including the oil market. And the Oil Volatility Index, or “OVX”, made a move today that may be sending an important message regarding this currently key asset.
To clarify, the OVX actually tracks volatility expectations on the USO, the United States Oil Fund
exchange traded product. However, the effect is the same with regards to the OVX’s relation to oil prices. When oil topped out in June 2014, the OVX established its all-time low since its 2008 inception. Since then, as oil and the USO have been pummeled, the OVX has been in a very clearly defined uptrend. And despite some fits and starts over the past year in the oil market, the OVX has remained relatively sticky in its elevated level, suggesting that market participants have remained steadfastly “fearful”. Today may have signaled the start of a change in that regime.
Why? The OVX dropped exactly 5 points today, or just over 10%. In the process, the index broke the post-2014 Up trendline – and in decisive fashion.
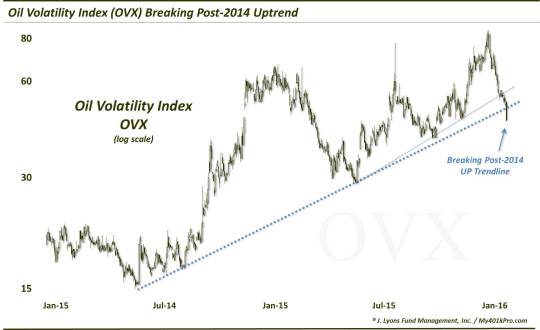
Using a logarithmic scale, one can see how the lows in the OVX in June and August 2014, June and November 2015 and earlier this month traced out a very neat Up trendline (FYI, on a linear scale, the post-June 2015 Up trendline was also decisively broken today).
So what does this mean? It means that market participants are, for the first time in years, expecting a lowering of volatility expectations relative to the recent trend. And while we are often tempted to fade what the crowd is thinking, the volatility market often has it right in these situations, i.e., at key junctures or changes in trend.
One example is a post we wrote on March 25 of last year. It highlighted the fact that, while oil prices had recently made a slightly lower low than the January lows, the OVX had held below its prior top, indicating a potentially positive divergence. Similar historical divergences had resolved themselves in higher oil prices and a lower OVX. Indeed, oil prices would immediately rally some 40% before commencing a new down leg.
These OVX signals are not foolproof, however. A case in point – when oil prices bottomed in February, the OVX did move to a new high instead of diverging. This signal gave us pause in declaring a likely durable oil bottom. However, tops and bottoms will never display unanimity of signals. Thus, we also need to look at tools that may be helpful in determining a change in trend if a top or bottom couldn’t be identified in real-time. That’s where this OVX trendline break may be sending an important message.
I know I have groused about one of our pet peeves, inter-market analysis, on several occasions. Simply put, our view is why try to figure out A by examining B when you can just examine A? In this case, however, at least the OVX is derived from data pertaining to the oil market itself. Thus, our view is that its message is most certainly relevant to the underlying oil prices.
And the message is that the steadily rising uptrend in oil volatility expectations has been snapped. It does not mean that oil prices will go straight up or that the OVX will go straight down. However, it is the first step in establishing a new regime whereby oil volatility is finally more subdued. Often that signals higher prices.
We don’t know for sure if higher prices are in the cards, but if the options market is correct, at least they will be calmer prices.
__________
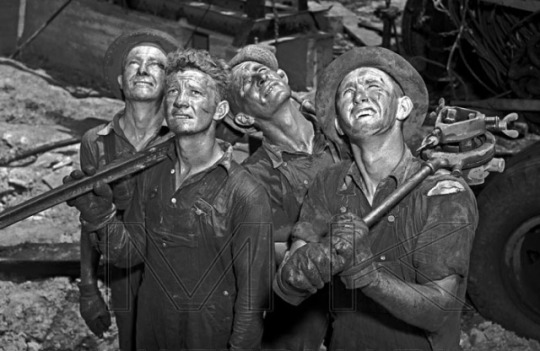
“Oil Field Workers” photo by Martin Konopacki Photography (1942).
More from Dana Lyons, JLFMI and My401kPro.
The commentary included in this blog is provided for informational purposes only. It does not constitute a recommendation to invest in any specific investment product or service. Proper due diligence should be performed before investing in any investment vehicle. There is a risk of loss involved in all investments.