Enjoy A Cup (And Handle?) Of Coke
The stock of Coca-Cola is breaking out to all-time highs – and out of a potentially bullish long-term pattern.
Readers may be aware of our view that U.S. stocks have likely entered a cyclical bear market. We can certainly understand why most observers don’t agree with that stance. A glance at the S&P 500 would suggest that that view is premature, at best. However, a broader market view lends a different perspective. For example, a look at the Value Line Geometric Composite, an unweighted average of about 1700 stocks, reveals that the median stock has already dropped more than 25% from its 2015 highs. Anyway, semantics aside, one common misconception about bear markets is that everything goes down during the entire duration. That is not the case as today’s Chart Of The Day indicates.
It is only during the teeth of a bear market that we typically witness the “nowhere-to-hide” dynamic. This is usually manifested in a capitulatory phase at the culmination of the bear market when investors give up and essentially all stocks decline. If this is a bear market, we don’t appear to be anywhere near that phase as evidenced by the continued effectiveness of relative strength. This approach, which we espouse, entails concentrating one’s portfolio in the strongest-performing segments of the market. And there continue to be pockets of identifiable strength in the market.
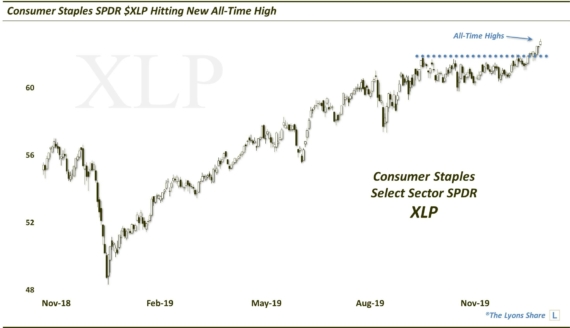
One area of relative strength has been the consumer staples sector, which is back at all-time highs following its early-2016 pullback. One subset of that sector that has been strong is the beverage industry. And one beverage stock, in particular, showing considerable potential still is one you may have heard of: Coca-Cola. In fact, just yesterday, Coke broke out to an all-time high – and out of a potentially long-term bullish pattern that it’s been in for 18 years.
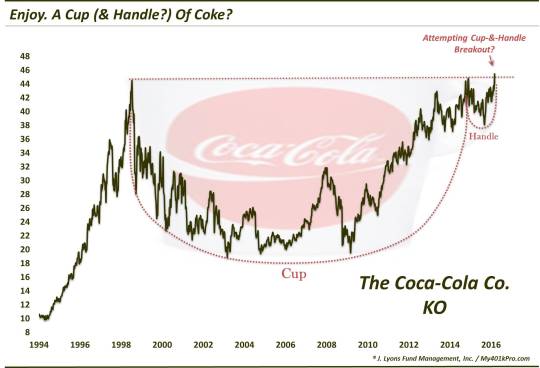
Market technicians may refer to the pattern in the above chart as a “cup-&-handle”. This is historically a pattern with very bullish implications. It involves 2 parts, generally showing the following characteristics:
The Cup: This phase includes an initial high on the left side of a chart (e.g., the 1998 high in Coke around $45), followed by a relatively long, often-rounded retrenchment before a return (e.g., late-2014) to the initial high.
The Handle: This phase involves a shorter, shallower dip in the stock and subsequent recovery to the prior highs (e.g., the 2014-2016 period in Coke).
The bullish theory is predicated on the idea that after taking a long time for a stock to return to its initial high during the “cup” phase, the “handle” phase is much briefer and shallower. This theoretically indicates an increased eagerness on the part of investors to buy the stock since they did not allow it to pull back nearly as long or as deep as occurred in the cup phase. Regardless of the theory, the chart pattern has often been effective in forecasting an eventual breakout and advance above the former highs.
How high does the pattern suggest prices will go upon a breakout? As we’ve mentioned before, we are not big fans of setting targets. We prefer to deal with price should it reach a certain level as opposed to expecting or relying on price to hit said level. That said, there are rules of thumb pertaining to how far price may go upon a breakout above the highs (i.e., top of the cup). Such targets vary between 50%-100% of the top-bottom range of the cup.
In the case of Coca-Cola’s stock, that would (hypothetically) imply a move to anywhere from $58 to $71. That would be a gain of between 30%-60% from here. I think investors would take that…even over a cup of Coke.
_____________
More from Dana Lyons, JLFMI and My401kPro.
The commentary included in this blog is provided for informational purposes only. It does not constitute a recommendation to invest in any specific investment product or service. Proper due diligence should be performed before investing in any investment vehicle. There is a risk of loss involved in all investments.