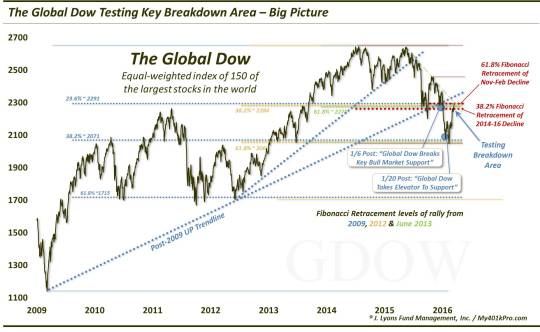
Global Stock Gauge Testing Key Breakdown Level

After rallying off major support for the past month, the Global Dow Index is testing its key January breakdown level.
Money managers and strategists all have their favorite indices that they feel best instruct them as to the market’s likely path, and thus, the most suitable investment posture. For us, our favored index is the Value Line Geometric Composite as it is a very broad, unweighted average that we feel paints the best picture of the state of the overall equity market. Another index that we have recently found particularly helpful is the Global Dow Index. The Global Dow is also an unweighted average – of 150 of the world’s largest companies. Thus, we feel it provides a decent barometer of the global equity market.
Another reason why the Global Dow has become a focus of ours is because it has adhered particularly closely to our charting analysis. Any security or index that behaves “as it should” is an attractive target for us, especially in this bizarro HFT era where so many charting outcomes have been completely opposite that of conventional wisdom. The Global Dow’s chart conformity is especially interesting since little to no money is directly traded off of it. Then again, perhaps that is precisely why it has worked so well recently. Consider some of our recent posts covering the Global Dow:
- On January 6, the index was among those that we mentioned had suffered potentially key breakdowns that day. Key levels broken that day included the post-2009 bull market Up trendline and a key cluster of Fibonacci Retracement levels from the major lows since 2009. By our assessment, that opened up an immediate 10% of additional downside before hitting the next, sequential Fibonacci Retracement cluster.
- Indeed, it took the index just 2 weeks to traverse that 10% pocket lower, arriving there on January 20, which we noted at the time. It subsequently bounced from that support level – like it should have – rallying back since, following a February re-test.
Fast forward to today and we find the Global Dow back near the key January 6 breakdown level.
Here’s a zoomed-in look.
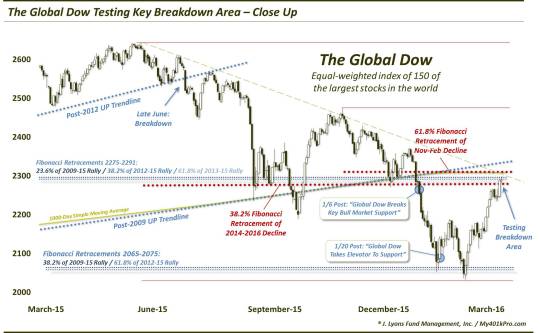
One of the basic tenets of technical charting analysis is that price has “memory”. That is, it should respond to price levels that proved impactful or significant previously. In this case, what had been support before the January 6 breakdown, now theoretically becomes resistance. And considering again the Global Dow’s recent obedient adherence to technical charting levels, the index should find this area nearby to be an uphill battle.
The underside of the post-2009 Up trendline is not far away. Nor are the Fibonacci levels. Add in the 1000-day simple moving average, the Down trendline from the May peak and 2 key Fibonacci Retracement lines from the recent decline (e.g., the 38.2% Fibonacci Retracement of the 2014-2016 decline and the 61.8% Fibonacci Retracement of the November-February decline) and you have some stiff potential resistance here for the index and the post-February global equity rally.
So, we would expect the climb to get a bit more arduous at this point for the Global Dow. On the other hand, if the index busts convincingly right through the area, it would be a good sign for the intermediate-term prospects of the rally (or perhaps it would mean that the HFT algo-bots have found our Tumblr).
_____________
More from Dana Lyons, JLFMI and My401kPro.
The commentary included in this blog is provided for informational purposes only. It does not constitute a recommendation to invest in any specific investment product or service. Proper due diligence should be performed before investing in any investment vehicle. There is a risk of loss involved in all investments.


