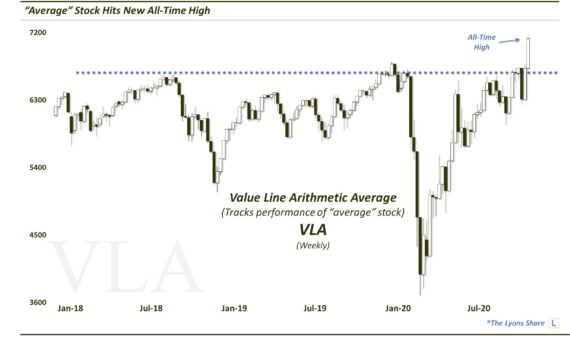
Key Equity Index Climbs Back Up The Elevator Shaft

The Value Line Geometric Composite, which broke critical support in early January leading to an immediate 12% drop, has climbed all the way back to the breakdown level.
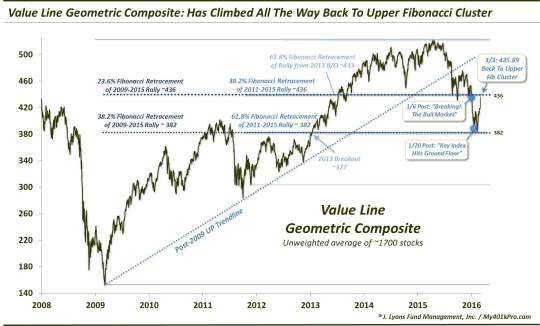
The Risk Model that orients our investment posture utilizes market inputs other than simply price in its construction. However, if we were to choose one price plot to guide our investment decisions, it would most certainly be the Value Line Geometric Composite (VLG). The VLG, as we have explained many times in these pages, is an unweighted average of approximately 1700 stocks. Thus, in our view, it serves as the best representation of the true state of the U.S. equity market. It has also historically been very true to technical analysis and charting techniques which is quite remarkable considering there are no tradeable vehicles based on it. And it has been remarkably accurate of late in offering guideposts for trading this market – something to keep in mind based the current level of the VLG.
Consider some of our posts this year focusing on the VLG:
January 6:
“BREAKING!: The Bull Market?”
The VLG breaks what we had labeled the “pass/fail” line around 436, signified by a cluster of key Fibonacci Retracement lines stemming from the major post-2009 bull market lows. The break of this level, besides perhaps dealing the fatal blow to the cyclical bull market, opened up an immediate 12% of further downside to the 382 level.
January 20: “UPDATE>>Just 2 Weeks After Breakdown, Key Index Hits Ground Floor”
Just 2 weeks later, the VLG tags the 382 level. This level, signified by the next sequential Fibonacci Retracement levels, also proves to be accurate, not only as a magnet but as support. The index would test the level again in February, ultimately forming a closing low of 383.82. From there, it has bounced, just as it was drawn up.
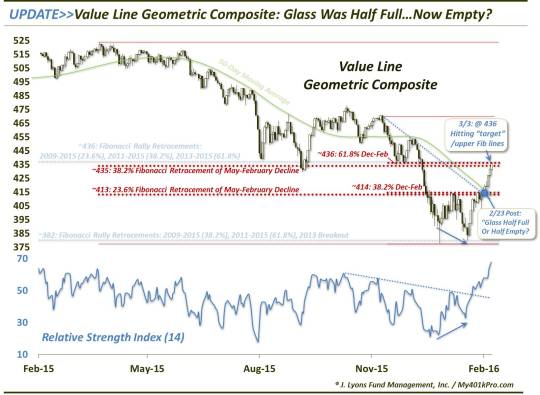
February 23:
“Is The Stock Rally Glass Half Full Or Half Empty?”
About 8 days into the February bounce, the VLG came to a crossroads halfway between the 382 and 436 level. The area included several potential points of resistance; however, based on some of the proprietary indicators that we track, there were suggestions that the rally was not over and that the VLG could push through the potential resistance. Based on that, we surmised that the VLG glass was half full and the index was more likely to rally another 6% to the 436 level than it was to visit 382.
Fast forward 8 more days to today and we find the VLG hitting a high of 437, confirming our short-term inclination and recovering all the way up the elevator shaft to where it broke down on January 6.
Short-term view:
Long-Term view:
So what now? Well, after rallying 14% in just about 3 weeks, a ratcheting down of upside expectations would certainly seem warranted. Sure, the VLG has favorable momentum here and the indicators we track are still pointing positive, so there could very well be some overshoot to the upside. However, considering how spot-on the VLG’s chart levels have been in marking turning points, it would seem wise to continue to pay some heed to the levels.
Furthermore, if you hold the view, as we do, that the stock market has entered into a cyclical bear market, the upside to any bounce may be capped. Thus, while the VLG has climbed from the ground floor all the way back up the elevator shaft, it may find the access to upper floors there rather limited.
________
More from Dana Lyons, JLFMI and My401kPro.
The commentary included in this blog is provided for informational purposes only. It does not constitute a recommendation to invest in any specific investment product or service. Proper due diligence should be performed before investing in any investment vehicle. There is a risk of loss involved in all investments.