
Traders Rush Back Into Hedges
By some measures, trading in inverse ETF’s has hit record levels during the recent selloff.
For the past several weeks (or even longer) we have been warning about extremely complacent sentiment among stock investors. Specifically, data from the equity options market indicated that hedging (i.e., put volume) was as scarce as it had ever been in the history of the data. Now, such a condition may not necessarily equate to a catalyst for a market selloff. However, the lack of hedging, or downside protection, certainly suggested that any decline that may occur would run the risk of accelerating quickly as traders began scrambling for protection. This is a scenario that we have seen unfold over the past week.
Specifically, in the Nasdaq/large-cap tech space, the selloff that began a week ago — directly from all-time highs — quickly began to snowball, presumably as unprotected traders rushed to sell or adopt protection. The result of the tenuous market structure was one of the swiftest 10% declines from a 52-week high in market history — just 3 days in the Nasdaq 100!
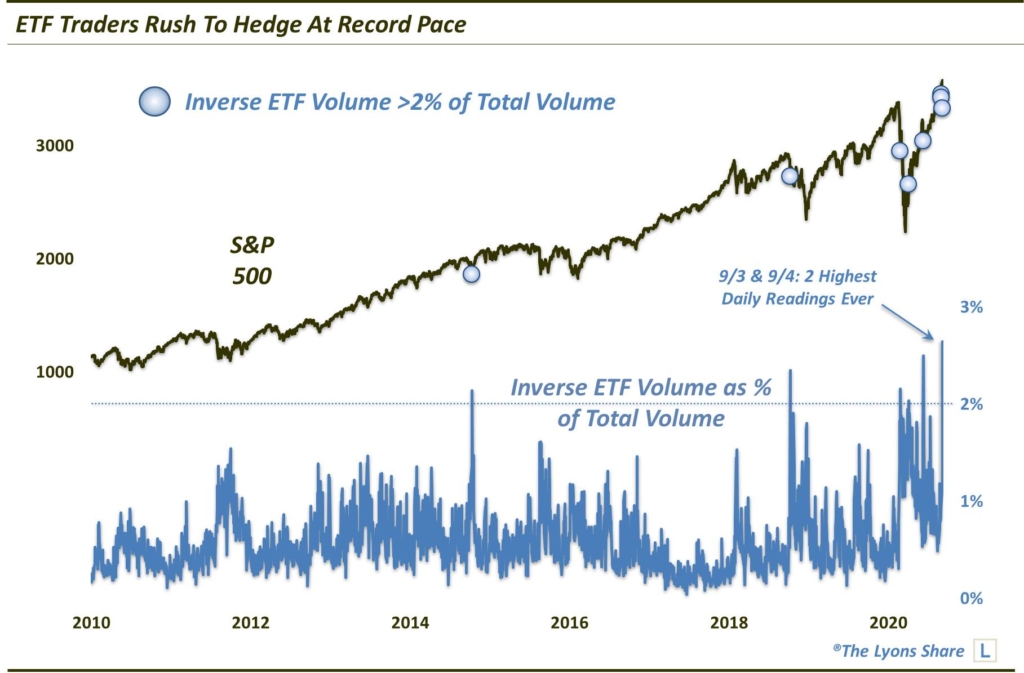
That’s the bad news. The good news is that all that scrambling for protection has wrung out a good deal of the complacency that led up to the selloff. In fact, by some measures, we have never before witnessed such a rush to put on hedges. At least that is the case when looking at trading volume in inverse exchange traded funds (ETF’s).
Of course, inverse ETF’s are designed to go up when their corresponding indices go down. That is why we call them hedges, or protection. And based on relative volume in such products, Thursday and Friday marked the busiest days ever in terms of ETF trader hedging. Specifically, volume in inverse ETF’s accounted for 2.69% of total exchange volume on both Thursday and Friday. Those are the highest readings we have ever recorded since we began tracking this indicator some 10 years ago.
FYI, the computation for this indicator, which we first saw utilized on sentimentrader.com, is a proprietary one. It does not include an exhaustive array of inverse ETF’s, but rather a group that we have been tracking now for about 10 years. Thus, someone else may come up with entirely different figures, though, likely the same general curve.
What is the takeaway from this data? Well, the rush into inverse ETF’s represents a healthy reversal of the complacency and lack of hedging we saw in the weeks and months leading up to last week’s top. In fact, from the bulls’ perspective, the more panic, the better from a contrarian standpoint. Of course, after coming off such low levels of hedging, it’ll take extreme panic to even put sentiment back into some balance. However, the heavy inverse ETF activity was at least good enough to contribute to yesterday’s sharp bounce in stocks.
The question is — is it sufficient enough to provide for a longer-lasting rally or merely a flash in the pan? Today’s reversal back down suggests it is the latter but the jury is certainly still out on this one.
How much “stock” are we putting into this data point? How is it impacting out investment posture? If you’re interested in an “all-access” pass to all of our charts, research — and investment moves — please check out our site, The Lyons Share. You can follow our investment process and posture every day — including insights into what we’re looking to buy and sell and when. Thanks for reading!
_____________
Disclaimer: JLFMI’s actual investment decisions are based on our proprietary models. The conclusions based on the study in this letter may or may not be consistent with JLFMI’s actual investment posture at any given time. Additionally, the commentary provided here is for informational purposes only and should not be taken as a recommendation to invest in any specific securities or according to any specific methodologies. Proper due diligence should be performed before investing in any investment vehicle. There is a risk of loss involved in all investments.


