
Options Traders Have Never Been So Complacent
The CBOE’s Equity Put:Call Ratio just registered the lowest reading on record.
Sentiment indicators can provide insight into the overall level of bullishness (i.e., greed, complacency, etc.) or bearishness (i.e., fear) in the market at a given time. When sentiment reaches an extreme in one direction or the other, the market becomes more susceptible to counter-trend move — and a rug-pull of the prevailing investor sentiment. We may be approaching such a condition based on data from the equity options market.
We prefer “real money” sentiment indicators as opposed to surveys as they reveal what traders are actually doing with their money. One example is an options put:call ratio. This indicator can measure trader bullishness (i.e., call volume) or bearishness (i.e., put volume) by the ratio of money going into either side. Currently, we can assume that bullishness among options traders is at an extreme based on the inordinate amount of money flowing into equity calls vs. puts on the CBOE. In fact, using a 10-day moving average, the CBOE Equity Put:Call Ratio just recorded the lowest reading (0.436) in the history of our database.
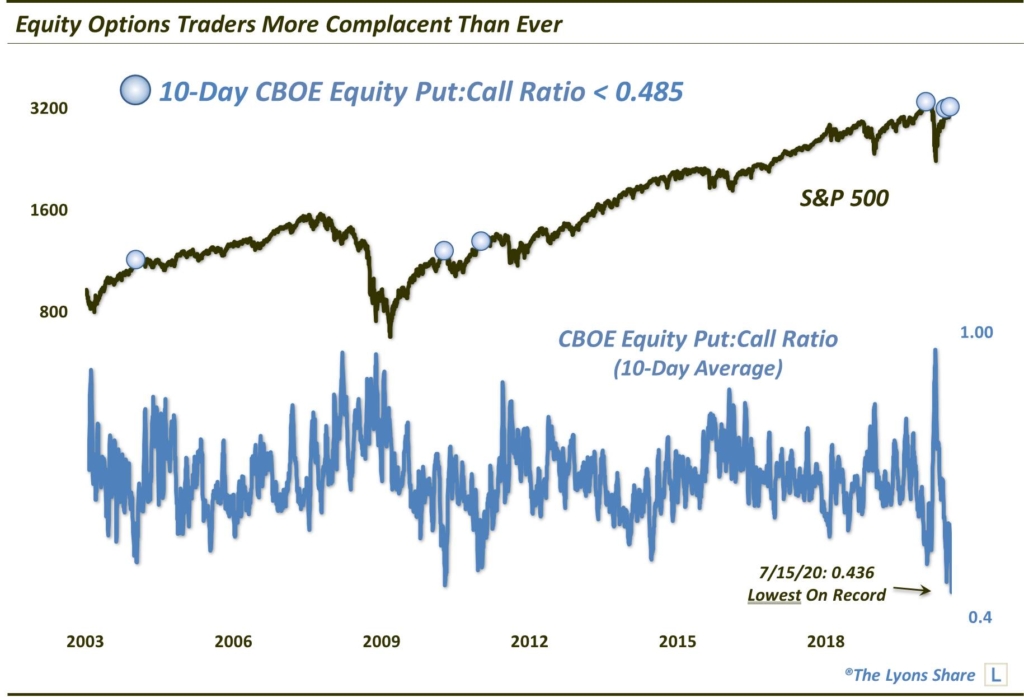
While this extreme reading may not necessarily mean the stock rally is over, it does suggest that further gains from here may be difficult to sustain — at least when looking historically at prior readings below even 0.485. Those 4 precedents going back to 2003 led to either an extended stagnation in the stock market (e.g., January 2004, January 2011) or an almost immediate and devastating decline (e.g., April 2010, January 2020).
As mentioned, this data point does not necessarily spell doom for the market. In fact, we would not consider it by itself to be a catalyst to a decline. However, should a catalyst present itself (or should the market merely begin to sell off), these conditions in the options market could exacerbate a potential decline. The reason being is that there is relatively very little hedging going on — and, thus, traders are exceedingly complacent and historically ill-prepared for a decline right now.
How much “stock” are we putting into this data point? How is it impacting out investment posture? If you’re interested in an “all-access” pass to all of our charts, research — and investment moves — please check out our site, The Lyons Share. You can follow our investment process and posture every day — including insights into what we’re looking to buy and sell and when. Thanks for reading!
_____________
Disclaimer: JLFMI’s actual investment decisions are based on our proprietary models. The conclusions based on the study in this letter may or may not be consistent with JLFMI’s actual investment posture at any given time. Additionally, the commentary provided here is for informational purposes only and should not be taken as a recommendation to invest in any specific securities or according to any specific methodologies. Proper due diligence should be performed before investing in any investment vehicle. There is a risk of loss involved in all investments.


