Global Equities Stake Key Technical Ground

The global equity market had a big week, arguably overcoming key levels of technical resistance…for now.
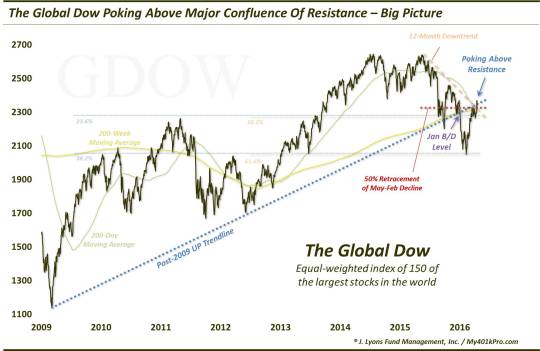
Much of the ink in this space over the past month has dealt with the battle between the breadth and momentum thrust off of the mid-February stock market low and the imposing technical resistance on the charts of most of the major averages. Just a week ago on CNBC, in fact, we laid out the litany of resistance layers nearby on the chart of the Global Dow. Of concern, many of the former lagging segments of the market had been repelled by this resistance for 3-4 weeks and were beginning to show the appearance of rolling over again.
What a difference a week makes.
Thanks in large part to Wednesday’s burst, many U.S. and global indices have rebounded to either challenge or surmount these identified levels of resistance. Included among them is the Global Dow. This unweighted average of 150 of the world’s largest stocks was able to overcome a daunting sextet of potential layers of resistance on its chart:
A closer look:
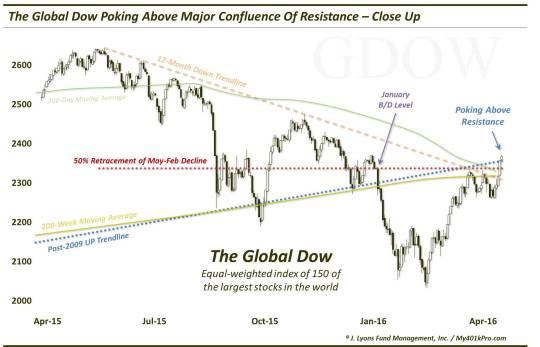
The resistance layers that we looked at, all in the vicinity of about 2320-2360, were the following:
- The underside of the broken post-2009 up trendline
- The post-2015 down trendline
- The 200-day simple moving average
-
The 200-week simple moving average
- The 50% retracement of the May-February decline
- The January breakdown level
As of yesterday’s close, the Global Dow was at 2367.20, above the upper end of this confluence of resistance, though not convincingly. Of course, the question now is can it stay above those former resistance levels? This will need to be monitored closely in this upcoming days.
As it stands now, score one for the breadth/momentum thrust off of the February low as the extended strength suggested by the thrust may now be manifesting itself. The move above resistance in several of the lagging market segments is a key development, and a necessary one for the extension of this rally. Couple this with the move to a new high by the NYSE Advance-Decline Line on Wednesday and it was a very good week for the bulls.
_________
Photo by
More from Dana Lyons, JLFMI and My401kPro.
The commentary included in this blog is provided for informational purposes only. It does not constitute a recommendation to invest in any specific investment product or service. Proper due diligence should be performed before investing in any investment vehicle. There is a risk of loss involved in all investments.


