Is Market Breadth Beginning To Sour?

Despite positive action in the major averages, market breadth has very recently begun to lag.
One of the hallmarks of the post-February stock market rally has been the superb breadth. That stood in stark contrast to the internal deterioration that had been in effect since about a year ago. This recent strong breadth dynamic has finally shown signs of potentially waning, however. One of the first signs we noticed was the new 7-year low in the ratio of micro-caps to large caps about a week ago. And we saw another piece of evidence pointing to breadth potentially starting to lag again last Friday, April 1.
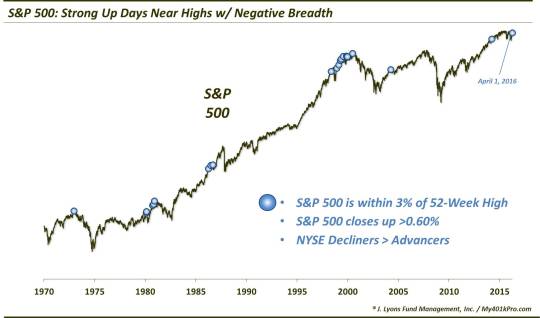
The major averages scored new rally highs yet again on Friday as the Dow Jones Industrial Average gained 100 points, the Nasdaq 100 was up 1% and the S&P 500 was higher by almost 2/3 of a percent. Despite that appearance of strength, in what was seemingly an April Fool’s joke, NYSE breadth was actually negative on the day (i.e., there were more declining issues than advancing issues). Now it is only one day so we wouldn’t make too much of it unless it becomes a larger trend. Furthermore, it was the first day of the month and quarter so there may have been some seasonal structural forces at work as well. However, it was unusual to see negative breadth on such a seemingly positive day in the market.
For example, in the past 50 years, it was only the 24th day that the S&P 500 gained at least 0.6% when within 3% of a 52-week high – and yet NYSE breadth was negative.
As the chart reveals, the previous 23 events occurred in both secular bull and bear markets. Therefore, while the sample size is on the small side, to the extent that there is any consistency to the performance measures following those events, they are probably more robust. As it happens, returns in the shorter-term have been fairly consistent – to the downside.
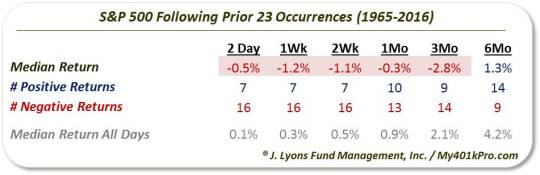
As the table shows, 16 of the 23 occurrences showed the S&P 500 lower from 2 days to 2 weeks following. Furthermore, even out to 3 months, the median return was almost -3%. Again, the sample size is small but it includes several occurrences during the secular bull market of the 1980′s-1990′s. In fact, even after a number of the occurrences during very strong advances in 1986 and 1999, the S&P 500 was some 6% lower 3 months later.
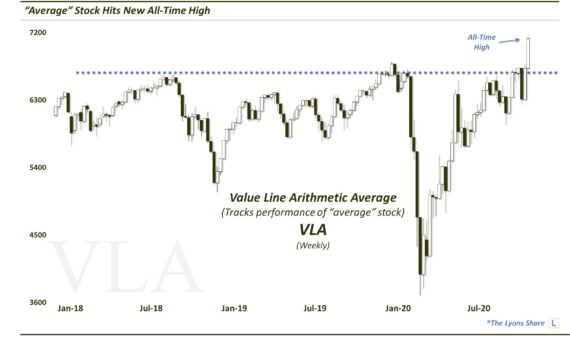
The rally since February has done very little “wrong” in terms of its quality of advance. Sure, many folks would have liked to have seen more volume accompanying the move. Furthermore, the broader indices are still a long ways from not only their all-time highs of last spring, but even from making higher highs above the peaks in late 2015. However, in terms of the pace of advance and the breadth measures involved, there has been little to complain about.
As the major averages are now pushing up against either their 2015 tops or the downtrends connecting those tops, it is perhaps not surprising to see the first signs of struggle in this rally. We have pointed out some preliminary evidence of complacent or overly bullish sentiment, at least on a short-term basis. Now, we are beginning to see the until-now stellar rally breadth begin to show cracks. Once again, we’ll emphasize that this is very preliminary evidence. A more substantial negative reversal in breadth is far from certain at this point and the burden of proof is on the bears to do more extensive technical damage to this uptrend.
However, for the first time since mid-February, the breadth situation is not looking quite as sweet as it was.
_________
More from Dana Lyons, JLFMI and My401kPro.
The commentary included in this blog is provided for informational purposes only. It does not constitute a recommendation to invest in any specific investment product or service. Proper due diligence should be performed before investing in any investment vehicle. There is a risk of loss involved in all investments.