Perhaps There IS Something To The Recent Positive Breadth Skew

A historical look at yet another day displaying disproportionately good breadth suggests that it may actually have relevancy in the near-term – in a bullish way.
An interesting trend that has recently emerged has been the continued stellar market breadth, even on days when the major averages have either languished or meandered, at best. This is in stark contrast to what we witnessed beginning about a year ago as the major averages were continuing to hit new highs while the broader market – and breadth – started to worsen. The difference, as far as impact goes, in our view, is that last year’s negative breadth divergence was a cumulative one that reflected the overall deteriorating broad market landscape. The current positive divergence (so far) has been only a very recent development, marked by “one-off” daily breadth anomalies. Thus, our sense is that one should be careful placing too much weight onto these potentially fluke occurrences.
Earlier this week, we looked at one such example pertaining to the Nasdaq. Based on historical precedents, that 1-day divergence seemed to be more trivial than anything meaningful. Furthermore, if there was a tendency following such dates, it was for weakness in the market. Today, however, we look at another positively skewed breadth event that occurred yesterday which, from a historical context, suggests that maybe there is a bullish message here after all.
So what made yesterday so unusual? Looking at stocks on the NYSE, over 77% of all issues advanced on the day. Despite that extremely positive breadth, the S&P 500 only managed to gain 0.19% on the day, thanks to declines in some of the largest, most heavily-weighted stocks in the index.
Going back to 1965, that was the 2nd worst day for the S&P 500 for any day when NYSE advancers accounted for at least 75% of all issues (some data providers show it as the worst day).
This chart shows all 630 days in the last 51 years that saw NYSE advancing issues at 75% or more of all issues – and the corresponding return in the S&P 500 for the day.
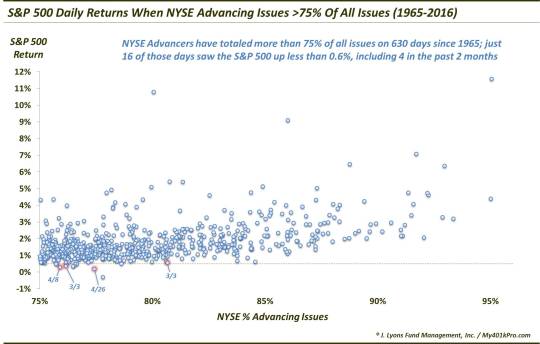
You can see April 26 representing the 2nd lowest S&P 500 return on such days. You can also see 3 other days within the past few months sitting toward the bottom of the sample. We wondered if there might be a bullish message underlying the lackluster performance of the S&P 500 given this recent out-sized positive breadth trend – unlike the conclusion reached from last Friday’s Nasdaq example.
Therefore, we looked at similar such days in the past 51 years for any hints of meaning to these events. Again, as yesterday’s circumstances were unprecedented, or nearly so, we relaxed the parameters a little to find a bigger sample size. Thus, we looked at all days since 1965 that saw at least 75% advancing issues on the NYSE, with a gain in the S&P 500 of less than 0.6%. As it turns out, there have been 15 such days, prior to yesterday. Again, 3 of those have occurred just since February.
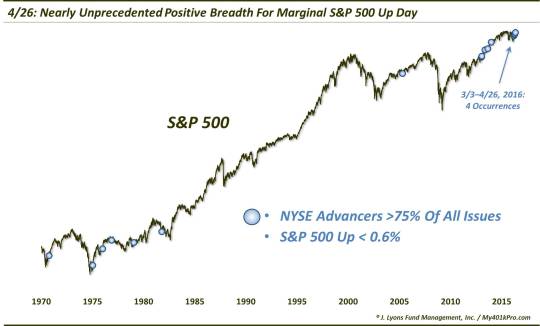
Interestingly, all 16 days have taken place within secular bear markets (if you consider the market to still be in one, as we do). However, all but 1, or maybe 2, took place during cyclical bull markets. Whether or not that is instructive as to the market environment we are in, we won’t be able to say for awhile. But we did find it interesting.
What we can say is how the market fared following these days. Now, whether or not the historical results are relevant certainly may be up for debate. However, we did find the results interesting enough to present here.
Here is the S&P 500′s performance following the prior 15 occurrences.
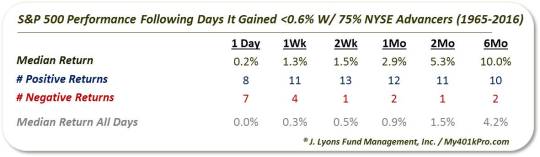
Obviously, again, we’re dealing with a limited sample size – and with 1-day phenomenons. However, statistically significant or not, the trend has been for the S&P 500 to show consistent strength, from 2 days to 6 months out. 3 weeks (not shown) following these occurrences, the S&P 500 was higher 14 out of 14 times.
These are the kinds of results that we wondered if we would see following days like last Friday. Obviously, that was not the case. And considering the similarities between the 2 days, the conflicting results cause us to take these results with a grain of salt. However, at least this time, the results do heavily lean to the bullish side.
So will the recent, persistent strong breadth prop up the lackluster large-cap averages, as it has
consistently
done in the past following these signals? Nothing is for certain in this business, but the near 90% success rate from 2 months to 6 months suggests that, maybe there is something to this positive breadth skew after all.
_________
More from Dana Lyons, JLFMI and My401kPro.
The commentary included in this blog is provided for informational purposes only. It does not constitute a recommendation to invest in any specific investment product or service. Proper due diligence should be performed before investing in any investment vehicle. There is a risk of loss involved in all investments.


