Asset Management Companies Should Dump Their Own Stock

An index of public asset management companies was just soundly rejected at key chart resistance.
Asset management companies make their living by deciding where to allocate money to or away from, and when. A number of these companies are publicly traded and part of an index called the Dow Jones U.S. Asset Managers Index. Like any other index, the Asset Managers Index can be tracked and charted. And based on our read of the chart, it might be wise for these managers to be allocating money away from their own collective stocks.
The reason for our view is that the Asset Managers Index was recently firmly rejected by what we would consider major chart resistance around the 167-168 level.
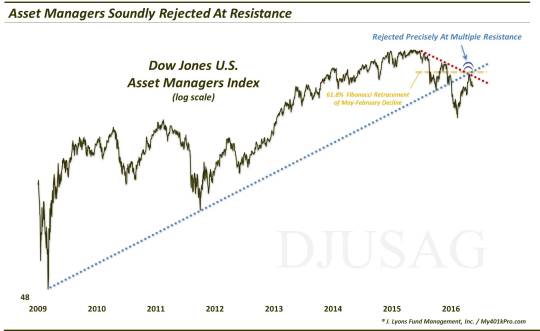
3 of the main sources of potential – and once realized – resistance are the following (on a log scale):
- The underside of the post-2009 Up trendline that was broken on January 6
- The 12-month Down trendline from the all-time highs last May
- The 61.8% Fibonacci Retracement of the May-February decline
The clear pattern of lower highs and lower lows is a telltale sign of a downtrend in progress. That is obviously bearish. It is also bearish when a security, index, etc. fails so easily and precisely at presumed resistance like this index did. That is an indication that the bulls don’t have a whole lot of fight in them.
Is there a larger message contained herein regarding the trends or fate of this industry? If there is, it’s probably above our pay-grade. Besides, it is much too short-term of a move to extrapolate any real-world structural theme. All markets are subject to ups and downs across these shorter time frames, regardless of their cyclical or secular trends.
We will say that these asset managers trade with a high correlation to banks and other financial institutions. This is no surprise since they are, duh, financial institutions. That would explain the out-sized advance in the Dow Jones U.S. Asset Managers Index today of more than 2% with the supposed specter of higher interest rates.
However, in the bigger scheme of things, the DNA of this chart is not constructive. The Asset Managers Index has suffered a clear breakdown and is in an unambiguous downtrend. Furthermore, the index failed feebly at key resistance. This should be more than enough evidence to persuade asset managers to avoid this area for now – even those managers included in this index.
________
More from Dana Lyons, JLFMI and My401kPro.
The commentary included in this blog is provided for informational purposes only. It does not constitute a recommendation to invest in any specific investment product or service. Proper due diligence should be performed before investing in any investment vehicle. There is a risk of loss involved in all investments.