Is REIT Rally Running Out Of Real Estate?

REITs, one of the hottest sectors in the market right now, may be running into chart resistance.
The popular saying goes that real estate is all about location, location, location. So it can also be said about price charts. The proximity of a stock, index, etc. to the important lines of potential support and resistance on a chart fully dictates the desirability of investing in that security at a particular time. For example, consider the chart of one of the hottest sectors in the market over the past 3 months –REITs.
REITs, or Real Estate Investment Trusts, have been on a tear since February. In just the past few days, REITs have accelerated their advance, hitting new 52-week highs
(thanks to bullish remarks by popular punditry). But while REITs’ relative strength is not in doubt, there are certain spots on the chart that may serve to slow down the advance. The sector may be at such a spot now, as judged by the Dow Jones U.S. Real Estate Investment Trust Index.
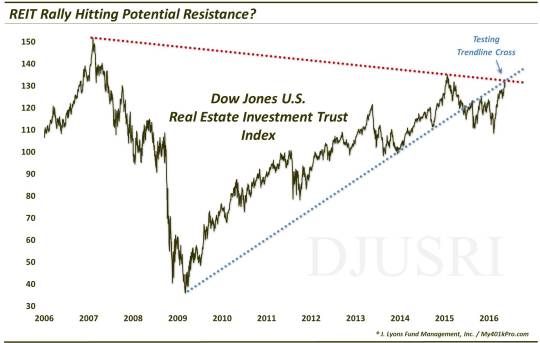
As the chart shows, while the recent break to new rally highs is a positive, the move has led the index squarely into potential resistance, in the form of 2 significant trendlines:
- The Down trendline from REITs’ all-itme high in 2007, connecting the early 2015 high, and
- The bottom side of the post-2009 Up trendline, connecting the 2013 and 2014 lows; this line was broken last June and successfully defended on 2 subsequent occasions.
We don’t know it these trendlines are going to stop, or even slow down, the REITs’ momentum. However, as we stated, it is important to understand and be aware of price’s proximity to potentially important lines of support and resistance. In this case, while the short-term action has been stellar, it is helpful to put it into the big picture context. Not only is the index continuing to put in lower highs on its long-term chart, but price is hitting 2 significant trendlines.
Again, we don’t know if this “resistance” will hold prices down, even temporarily. However, if one is considering chasing this rally, it may be useful to apply the old real estate saw – charts are all about location, location, location. And in this case, the property above the 2 aforementioned trendlines is much more desirable real estate for REITs owners.
_________
More from Dana Lyons, JLFMI and My401kPro.
The commentary included in this blog is provided for informational purposes only. It does not constitute a recommendation to invest in any specific investment product or service. Proper due diligence should be performed before investing in any investment vehicle. There is a risk of loss involved in all investments.