Is The Oil Rally Getting Clogged Up?

Crude oil prices may be hitting the most significant level of resistance since launching their rally in February.
In a year of interesting market moves, probably the one with the most attention, and ink is the rally in crude oil. Rightly or wrongly, market observers are pinning the ups and downs of just about every market and asset class on the behavior of oil prices. Given the commodity’s obvious influence and significance, the attention is understandable. What people really want to know is – is the rally for real? and how far will it go? We don’t have a crystal ball and we suggest you avoid those prognosticators who talk as if they do. But we can speak to the action thus far in crude prices and the potential key levels on the chart. And based on that evidence, our view is that the rally in oil prices may now be testing its staunchest resistance to date.
What is the evidence? Consider the Chart Of The Day:
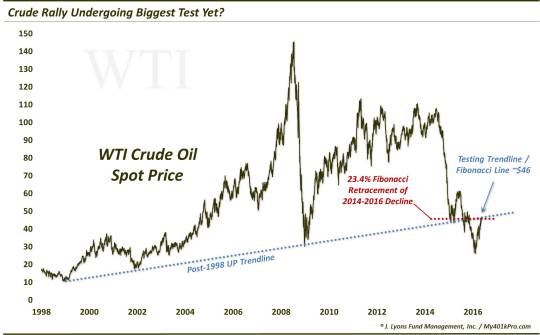
As the chart indicates, the spot price of WTI Crude Oil is hitting a few potentially key levels here around $46. First and foremost would be the Up trendline dating back to the 30-year low in WTI in 1998. The trendline served as support at the lows in 1998, 2001, 2008 and temporarily in March-October 2015. Prices broke below the trendline in November, precipitating the most recent and perhaps final plunge in oil. Subsequently, WTI prices have rallied back to, presently, test the underside of that uptrend line. Theoretically, the former support should serve as resistance.
Additionally, we have the 23.6% Fibonacci Retracement level of the 2014-2016 decline in the vicinity of $46. This is the first significant Fibonacci line to watch. Lastly, we have the lows of January and March 2015, as well as the breakdown point in November here near the same level.
Interestingly, but perhaps not surprisingly, we noted earlier this week that the price of oil stocks, in the form of the NYSE Oil Index (XOI) was also testing a key “make-or-break” level of its own. We probably should not be surprised by the symmetry and, in fact, it likely further validates the analysis of each price series as being at a critical juncture.
Will the oil rally stop here? We have no idea – but we wouldn’t be surprised to see the rally get clogged up, at least temporarily.
_____________
More from Dana Lyons, JLFMI and My401kPro.
The commentary included in this blog is provided for informational purposes only. It does not constitute a recommendation to invest in any specific investment product or service. Proper due diligence should be performed before investing in any investment vehicle. There is a risk of loss involved in all investments.