Will The (Falling) Buck Stop Here?

The recent decline in the U.S. Dollar has people wondering where it might stop; its chart suggests right here is as good a spot as any.
Increasingly, the talk surrounding financial markets lately has centered around the U.S. Dollar (USD). Specifically, the focus is on the 5-month decline in the USD. Obviously, as much as any asset, the behavior of the USD has an impact, directly or indirectly, on many other assets within the financial markets. Thus, with the USD falling as it has recently, it has received much of the blame (or credit) for the unwanted (or welcomed) consequences on the behavior of other assets.
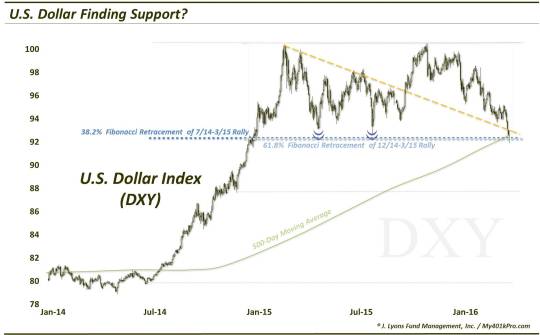
Therefore, market participants are wondering where is the drop in the USD going to stop? Today’s Chart Of The Day takes a peek at the chart of the U.S. Dollar Index (DXY) to identify potential areas of support. As it turns out, probably the most convincing level in terms of its likelihood in providing support is right where the DXY is currently trading, near 92.50. As the following chart shows, there are a few lines of interest here that may serve as potential support. These include:
- The 38.2% Fibonacci Retracement of the DXY’s big rally from July 2014 to March 2015.
-
The 61.8% Fibonacci Retracement of the rally from the December 2014 interim low to the March 2015 high.
- The bottom of the 14-month trading range since the March 2015 top, which was tested a couple of times last year.
- The 500-day simple moving average
- The top side of the post-March 2015 down trendline that was broken in October of last year.
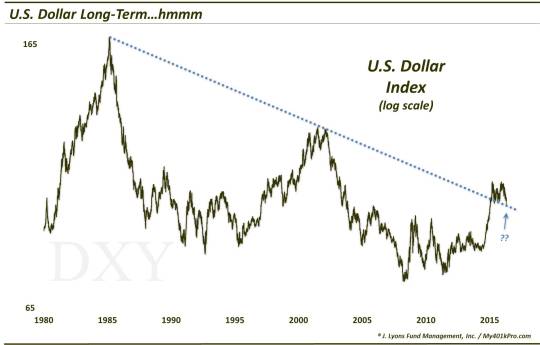
Additionally, if we zoom out a little bit, we find another line of interest in its potential to provide support here (the key word being potential). This is the top side of the down trendline from the DXY’s 1985 all-time high, connecting the 2001-2002 highs. The DXY broke through that trendline in its final push to its March 2015 highs. Subsequently, the lows in May and August 2015 seemed to find support near this long-term trendline.
On a side note, so-called “smart money” commercial hedgers in the USD futures market are showing their smallest net short position since the 2014-2015 rally began. They have not yet reached a net long position, which has coincided with several intermediate-term bottoms over the past decade. However, what was a potential headwind a year ago is no longer one.
On another side note, the clamor over the USD’s decline seems a bit of a reach to us. In our view, the USD has really been in a sideways trading range over the past 1 year plus. Considering the magnitude of the preceding rally, the counter-trend move has actually been extremely mild. In fact, going back 45 years, the size of the DXY’s range of the past 14 months is in just the 9th percentile of all periods. In our view, while there are always exceptions, this type of action is often characteristic of a continuation pattern. That is, once the pattern runs its course, the likely direction of prices is a continuation of the preceding trend, i.e., up.
So will the buck stop here? We have no idea. However, based on a glance at the intermediate-term and long-term charts of the DXY, current levels offer as compelling a confluence of potential support as any down to the July 2014 liftoff area.
__________
More from Dana Lyons, JLFMI and My401kPro.
The commentary included in this blog is provided for informational purposes only. It does not constitute a recommendation to invest in any specific investment product or service. Proper due diligence should be performed before investing in any investment vehicle. There is a risk of loss involved in all investments.