Not Your Everyday Pounding

The British Pound wasn’t just hammered
In the wake of “Brexit”, it broke historic support in the process.
On a truly historic day like today – especially across the pond – there are infinite numbers of statistics and charts available to express the superlative nature of the day. It is frankly a day that stat-hounds like ourselves eat up. However, A) there are so many epic charts that we could show that it can be overwhelming, and B) on days like this, you don’t need chart grinders like ourselves to publish them – they are readily available elsewhere. Therefore, we are only going to show one Chart Of The Day, and a very brief post for color. But it is likely the most relevant and meaningful chart to arise out of today’s developments. It deals with the historic shellacking in the British Pound.
We aren’t going to opine on the ramifications of today’s record 8% decline in the Pound. Nor are we interested in discussing the repercussions of Brexit. Likely everyone has heard as much as they could possibly want to hear on the subject. We are charts and quant people anyways, so we’ll just stick with the data. Thus, while folks are also likely aware of the huge decline in the Pound today, they may not be aware of the significance of the level broken today. That’s the emphasis of our ChOTD.
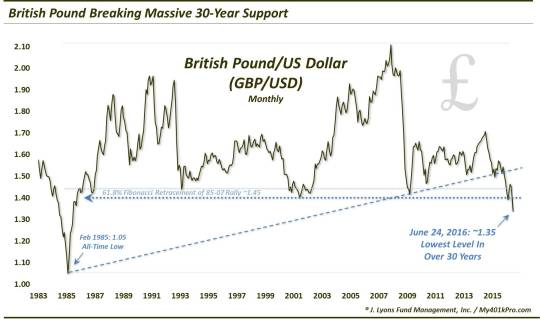
As the chart shows, today’s massive drop sent the Pound to its lowest level – around 1.36 to the Dollar – in 31 years. Not only that, but the level that the currency broke is just as significant. For the past 30 years, the 1.40-ish level has served as support for the Pound on several occasions (FYI, 1.40 is also in the vicinity of the 61.8% Fibonacci Retracement of the Pound’s 1985-2007 rally). In 1986, 1993, 2000-2002 and 2009, the currency saw significant declines halted in the vicinity of 1.40. During those 30 years, the level never faltered. That changed today.
The dramatic manner in which this event unfolded certainly could not have been anticipated. However, perhaps the fact that the Pound has broken down should not be a surprise. We don’t deal with currency trading too often, but we did publish 2 posts in the past 14 months pondering the fate of the Pound. The analysis in these posts were strictly chart-based, but they came to the same conclusion: the Pound was destined to break down below the 1.40 level:
April 10, 2015: “Is the British Pound the Next Currency to Collapse?”
February 25, 2016: “FX: Cable Gets Pounded”
Now, we’re not here to do victory laps. We just want to point out that charting and technical analysis (yes, that voodoo) can be useful in tipping one off to potential major developments. Additionally, in this particular instance, while many are aware of the huge decline in the Pound, perhaps they were not aware of the significance of the levels being broken. And considering that development, the pounding may be just getting started.
________
More from Dana Lyons, JLFMI and My401kPro.
The commentary included in this blog is provided for informational purposes only. It does not constitute a recommendation to invest in any specific investment product or service. Proper due diligence should be performed before investing in any investment vehicle. There is a risk of loss involved in all investments.