O (No?) Canada

Canadian stocks are testing a potentially significant breakdown.
Believe it or not, the dog days of a Wall Street summer are just around the corner. And it appears as if the dog days of the post-February stock rally have already arrived. The rally has stagnated and stocks appear to be stuck in limbo. On the one hand, you have the former all-time highs and a slight deterioration in breadth conditions while on the other, you have conditions that are not yet ripe for any type of material breakdown in the broad stock market. Therefore, it would not be a surprise to see stocks continue to drift for a time while waiting for either side to build up a more convincing case.
That said, there has been one possible bearish change in character since the calendar turned to June. That is, while the post-February rally had thus far seen prices of most indices able to clear key resistance quite easily, that is no longer the case. We have seen multiple examples recently where various segments of the market have stopped precisely at obvious resistance levels – like they’re supposed to. The Canadian stock market is one such example.
After topping out in September 2014, Canada’s main stock market index, the S&P TSX Composite (TSX) has made a series of lower highs and lower lows. That said, the rally in the TSX since January has been quite impressive, tacking on about 25% and making a slight higher high on a short-term basis. However, as mentioned the TSX rally stopped earlier this month right near resistance where it was supposed to. And it is fairly formidable looking resistance.
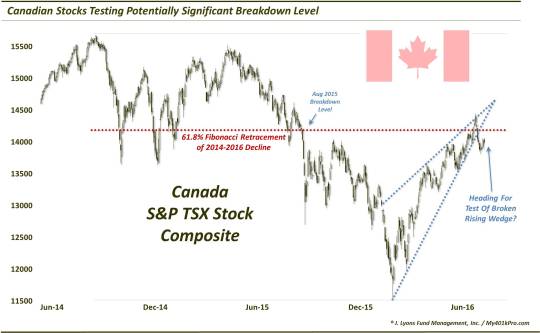
As the chart shows, there are several analyses around the 14,250 level that make the recent peak quite compelling as a potentially more substantial top. First off, we have the all-important 61.8% Fibonacci Retracement level of the decline from the 2014 top to the January low. Secondly, we have the breakdown level from August 2015, from which the decline in the TSX significantly accelerated. In addition, we have the 500-day moving average (not shown), which does a fairly good job of delineating longer-term trends.
Lastly, we arguably have a pattern traced out since the February lows called a rising wedge. A rising wedge consists of higher lows and higher highs, with the highs rising at a shallower trajectory than the lows. And despite the higher lows and highs, the pattern is actually a bearish formation. In our experience, more times than not. the rising wedge culminates with prices breaking down below the lower bound. That is precisely what happened in the TSX about 10 days ago.
This loss of the lower trendline of the wedge is potentially devastating for the TSX, in particular because it occurred just off of multiple, transparent resistance levels. The index is making a run right now, possibly, at testing the breakdown level of the wedge, etc. Should this test fail as soundly as the TSX did upon its initial foray into resistance, it may well be reasonable to begin considering that the early-June high was the top for the post-February rally.
Again, while the formidable resistance is the key takeaway as it pertains to the TSX, the larger message for the broader market is that rallies in various markets are beginning to fail right where they should. This shows a drying up of demand. It is also a far cry from the first several months of the post-February rally wherein markets around the globe were blowing through resistance levels that should have stopped them.
That action was likely the result of the breadth and momentum thrust off of the February lows that carried markets farther than expected. At this point, the benefits of that thrust have likely run their course. Markets are beginning to trade again based on their own, current merits. For the broader market, that may mean that stocks will continue to drift sideways until clearer evidence arises suggesting a big move, up or down.
However, based on its chart, and prices’ reliable adherence to it, the Canadian stock market would probably be lucky, at this point, if it was able to merely drift sideways.
________
More from Dana Lyons, JLFMI and My401kPro.
The commentary included in this blog is provided for informational purposes only. It does not constitute a recommendation to invest in any specific investment product or service. Proper due diligence should be performed before investing in any investment vehicle. There is a risk of loss involved in all investments.