Options Traders (Over?) Trim Their Hedges

After displaying extreme caution just a month ago, equity options traders have trimmed back their hedges – perhaps too aggressively.
Over the past few months, the majority of our posts and commentary have focused on various factors suggesting why the post-February stock rally may go farther and last longer than we had originally anticipated. These factors related to breadth, momentum and sentiment among others. And while some of the positive potential has been wrung out with the rally over the past few weeks, for the most part these bullish factors will remain constructive until the market turns south. One factor that is clearly less favorable than just a month ago, however, is sentiment – especially that which is derived from the options market. Just within the last month, the level of hedging going on in equity options was at an extreme, particularly given the moderate losses in the market at the time. That is no longer the case.
Specifically, the data from the International Securities Exchange equity (ISEE) options market yesterday gave a red flag. If you recall, three weeks ago, we pointed out the extreme low reading in the ISEE Call/Put Ratio (i.e., traders were buying very few calls relative to puts). This, again, was very odd, even unprecedented, to see in light of the minimal losses in the stock market over the preceding few weeks. And indeed, the positive repercussions suggested by that sentiment reading were realized over the subsequent weeks.
The sentiment has now swung, however – at least in the short-term. Yesterday’s ISEE reading of 254 (i.e., 254 calls bought per every put), was the highest in more than 2 years. It was particularly unusual to see such a high reading on a down day in the market. Since 2006, in fact, there have been just 44 other days that saw the ISEE come in over 230 on a day the S&P 500 closed lower. In general, the market struggled in the short-term following those cases, with no real gains, on a median basis, for up to 3 months later.
Another unusual aspect of yesterday’s reading is that it comes on the heels of an extreme low reading of 87 just 2 days ago. Now, of course when we are talking about daily readings, we are dealing with short-term signals. However, historically, the market has consistently struggled, again, following such quick reversals from an extreme low to an extreme high. Specifically, we are talking about instances when the ISEE went from less than 100 to over 201 within a 5-day span. Since 2006, this is just the 11th such event.
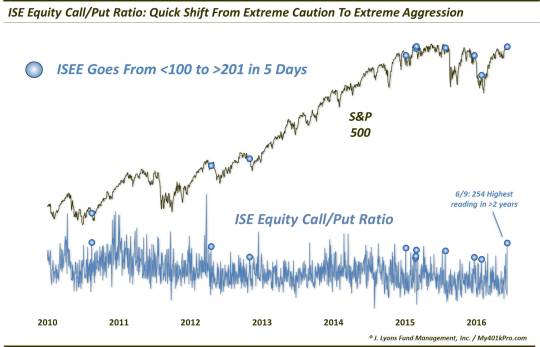
As the chart shows, this has been a bit of a recent phenomenon. After just 3 signals between 2006 and 2014, there have now been 8 in the past 15 months. And again, the S&P 500 has tended to struggle following these signals. Here is the index’s performance following the first 10 occurrences.
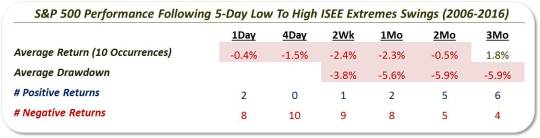
Of particular note is the fact that at least 8 of the 10 showed losses over every time frame up to 1 month. Also, the 1 month average drawdown of -5.6% is about double the average following all days. After 1 month, returns evened out a bit, so it appears to be a short-term phenomenon, as one daily data point would suggest anyway. Besides, with the vast majority of events occurring in the past year and a half, we don’t have much longer-term history to go on.
Given today’s near 1% drop in the S&P 500, 2 things come to mind. First, it lends validity to the warning from this signal once again, hinting that traders have flipped extremes too quickly. Secondly, no doubt some of the sting of the signal has already been inflicted. Unfortunately we cannot always get posts out before the market open (though, we did post the chart pre-market on Twitter and StockTwits – follow us there @JLyonsFundMgmt for more frequent and timely charts.)
What’s the takeaway? There have been numerous factors over the past few months suggesting to us that our bullish expectations for the post-February rally should be ratcheted up even further. Good breadth and strong momentum are among them and, while the market has bounced strongly over the past month, those factors are still in the favorable camp. On the other hand, sentiment, which was downright dour a month ago, has shifted rather quickly. This includes survey and real-money sentiment indicators, such as the extreme bullish reading in the ISEE.
The sentiment pendulum has not swung enough to be a negative factor in the longer-term, in our view. However, we cannot say it is a tailwind anymore. In the short-term specifically, however, equity options traders probably trimmed back their hedges just a bit too aggressively.
_____________
More from Dana Lyons, JLFMI and My401kPro.
The commentary included in this blog is provided for informational purposes only. It does not constitute a recommendation to invest in any specific investment product or service. Proper due diligence should be performed before investing in any investment vehicle. There is a risk of loss involved in all investments.