Are REITs About To Blow The Roof Off?

An index of U.S. REITs just experienced a potentially major breakout from a decade-long bullish chart pattern.
Following what we viewed as the popping of a likely real estate bubble in 2006-2007, our guess was that, after a dead-cat bounce, the sector would be dead money for some time. Almost 10 years later, apparently we thought wrong. Whether we are witnessing an echo bubble or whatever, real estate money is alive and well on some fronts. One such area
has been Real Estate Investment Trusts (REITs). Now it is certainly arguable that REITs have been artificially propped up by the low-rate (or no-rate) environment and its accompanying affordability, access to deal financing and attractive dividends relative to fixed income instruments. Whether that’s indeed the case or not, though, we don’t care. All that matters to us is the fact that a major U.S. REIT index has just hit an all-time high – and in the process, has broken out of a potentially very bullish decade-long chart pattern.
The index is the Dow Jones U.S. Select REIT Index. The chart pattern arguably in force on the chart is a “cup-&-handle”. We have discussed this pattern in other posts in the past, including the fact that it typically is considered to be a bullish pattern. What does it look like and why is it bullish? The pattern involves 2 parts, generally showing the following characteristics:
The Cup: This phase includes an initial high on the left side of a chart (in the beginning of 2007, in this case) followed by a relatively long, often-rounded retrenchment before a return to the initial high (in January 2015).
The Handle: This phase involves a shorter, shallower dip in the security and subsequent recovery to the prior highs (last month).
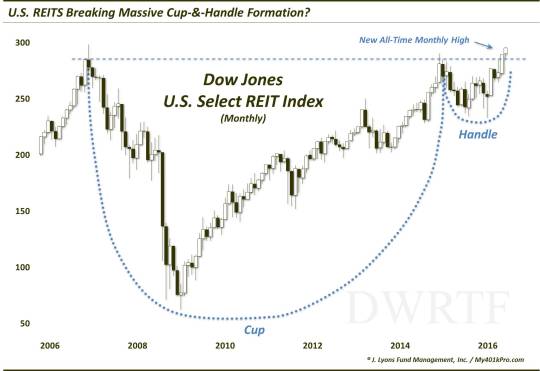
The bullish theory is predicated on the idea that after taking a long time for a security to return to its initial high during the “cup” phase, the “handle” phase is much briefer and shallower. This theoretically indicates an increased eagerness on the part of investors to buy the security since they did not allow it to pull back nearly as long or as deep as occurred in the cup phase. Regardless of the theory, the chart pattern has often been effective in forecasting an eventual breakout and advance above the former highs. And indeed, the Dow Jones U.S. Select REIT Index has broken out to new highs over this past month.
So how far does the pattern imply the index might rally after the breakout? That is certainly more of an art than science, but various technicians argue for a 50%-100% extension of the range of the “cup”. In this case, the cup ranges from a high around 100 to a low of 21.60 in 2009. Therefore, the range is about 80 dollars.
Based on the 50%-100% rule of thumb, if successful, the recent breakout would suggest an advance of 40-80 above the top of the range. That would be an extraordinary move, especially given the latter stages of the market cycle. Speaking of latter stages, we have warned many times about the market’s recent propensity for “false breakouts”. This is something to watch for in the event that prices do drop back down to (or below) the breakout point near 100.
Incidentally, it is not just the index that is breaking out above a potential decade-long cup-&-handle. Two of the most popular REIT ETF’s also share that same look as the Index.
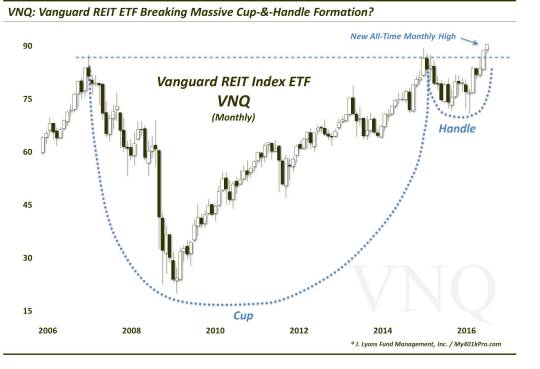
First off, here’s the Vanguard REIT ETF (VNQ) breaking out of a post-2007 cup-&-handle.
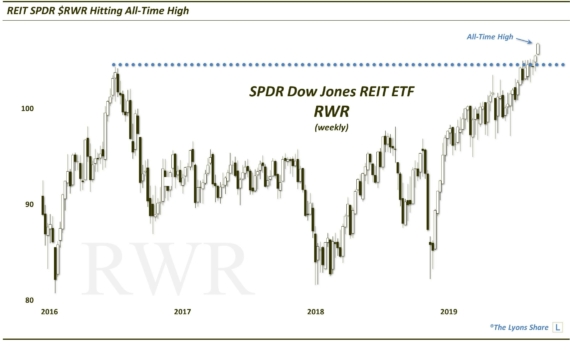
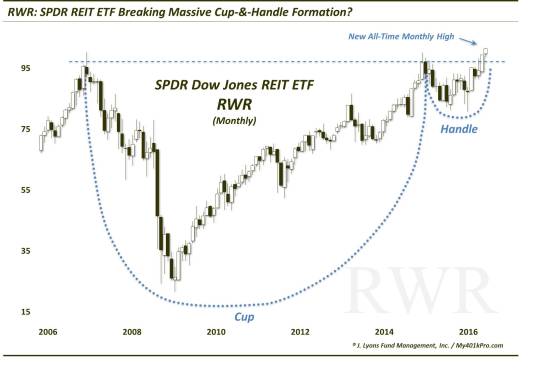
Similarly, the SPDR Dow Jones REIT ETF (RWR) has just broken above its own potential 10-month cup-and-handle .
So what is the bottom line? While we remain leery of the aging equity bull market in the longer-term, in the near to intermediate-term, there is nothing more bullish than new all-time highs. Thus, until prices fall back below the breakout level, expect REITs to remain constructive – and perhaps blow the roof off.
_____________
More from Dana Lyons, JLFMI and My401kPro.
The commentary included in this blog is provided for informational purposes only. It does not constitute a recommendation to invest in any specific investment product or service. Proper due diligence should be performed before investing in any investment vehicle. There is a risk of loss involved in all investments.