
Stay Of Execution For The Bull?

This piece originally appeared as the June 2016 edition of the J. Lyons Fund Management, Inc.
Newsletter at www.jlfmi.com.
Positive developments in recent months may have extended the life of the bull market – but for how long?
“One more day to complete my service.
One more high to decay my nervous.
Wondering how I’m gonna find, it’s over.”
– Nirvana – “Old Age”
It’s no secret that we have been concerned about a potential market top of some significance forming over the past 12 months (or longer). In fact, as we have documented, many pieces of evidence pointing to the immediacy of such a potential top have been accumulating over that time. The substantial deterioration in the broad market last year, as revealed through the collapse in breadth was a major red flag. Additionally, what looked like the final bull market holdout – prices of the major stock averages – finally gave way last summer and into the early part of this year. So the cyclical stock market top that we were concerned about looked as if it was indeed unfolding on schedule.
Our view of the ultimate fate of the market cycle has not changed, particularly as it pertains
to the broad market of stocks. There are simply too many secular excesses that have yet to be worked off. However, our view of the path leading to that eventual end-game may have been altered somewhat in recent months. Specifically, the timing of the onset of the cyclical bear market may have been forestalled.
Our consideration of this potential “stay of execution” of the bull market has stemmed from a series of recent positive developments in the context of the better-than-expected post-February stock market rally. Some of these bullish factors have already played themselves out while others remain constructive. Still other potential positives require close monitoring as the extent of their influence is up in the air. This piece will take a look at some of the developments that caused us to upgrade our assessment of the rally in recent months. Additionally, we will take stock of the present status of these factors in the context of their potential remaining positive influence.
Again, our analysis does not suggest that a cyclical top, and the accompanying supporting evidence of the past 12 months, is to be dismissed. That scenario still appears to be on track. However, the aforementioned positive developments may have bought the bull market a little more time, and perhaps another high, before its eventual slaughter.
Disclaimer: While this study is a useful exercise, JLFMI’s actual investment decisions are based on
our proprietary models. Therefore, the conclusions based on the study in this newsletter may or may not be consistent with JLFMI’s actual investment posture at any given time. Additionally, the commentary here should not be taken as a recommendation to invest in any specific securities or according to any specific methodologies.
NYSE Advance-Decline Line
So what are these positive developments? Not the least of them is the fact that the NYSE
advance-decline line has gone to a new all-time high.
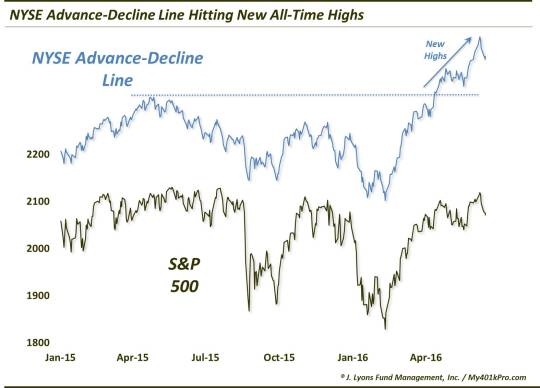
As a refresher, the advance-decline line is a running cumulative total of the daily difference
between advancing issues on the NYSE and declining issues. If this “A-D” Line is moving upward along with the stock indexes, it represents strong participation within the broader market. And as we have said many times, the better the participation, the healthier the market. Since the mid-February stock market low, the A-D Line has indeed been moving upward, hitting its first new high in April after 355 days.
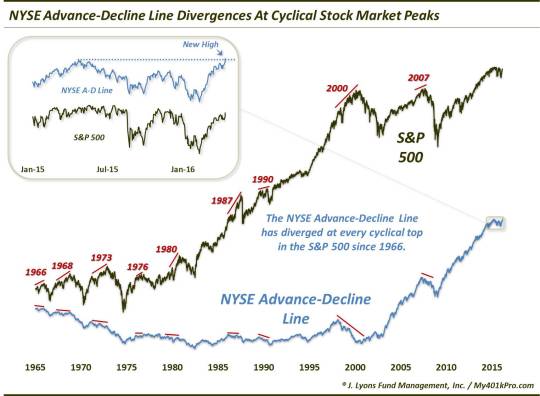
So what is the significance of the new high? The NYSE A-D Line has negatively diverged at
every cyclical top in the S&P 500 in the last 50 years.
So what now? Does the new high in the A-D Line mean the bull market is back on track – or never left? Not necessarily. Our best guess still, based on all the evidence at hand, is that the broad stock market formed (or is still forming) a cyclical top over the past 12 months. We realize that may be a difficult proposition to grasp for market observers who only watch the price of the S&P 500.
However, consider the fact that broader averages like the NYSE Composite, the Value Line Arithmetic Index (i.e., average stock) and the Value Line Geometric Composite (median) are still some 10%-15% below their highs of a year ago. Also consider the litany of examples of deterioration in market internals that we’ve documented over the past year which have traditionally led to multi-year struggles in the broad equity market. These factors (and others) combined still point to a strong likelihood that the market action of the past 12 months is part of a topping process.
Strictly based on the historical relationship of the NYSE A-D Line and S&P 500 around cyclical
tops, however, the evidence would suggest that the S&P 500 has not yet made its final high for the cycle. Remember that the A-D Line has topped before the index at every cyclical top in the last 50 years, without exception. Now, it is possible that last year’s A-D line divergence at the high still “counts”, despite its recent run to a new high. However, based on the traditional relationship, the fact that the NYSE A-D Line has hit a new high suggests that A) the A-D Line has not put in its ultimate divergence and, therefore, B) the S&P 500 has not yet topped.
Even if this relationship holds true and the final top is still ahead of us, it does not tell us how far out or how much higher the S&P 500 rally might extend. The A-D Line could top next week and the index shortly following for all we know. However, if history holds true to form here, the S&P 500 all-time high close of 2130.82 on May 21, 2015 will not be the final high of this cycle.
Laggards Provide Fresh Fuel
While the bounce in the stock market in mid-February was not a surprise, its potential magnitude of course was an unknown. Would it be simply a mean-reversion, dead-cat bounce to relieve “oversold” conditions? That scenario would play into the premise that the bounce simply equated to a “bear market rally” and had limited potential upside. Or would it be more than that – possibly containing the potential for new highs in the major stock averages? The determination, as always, is best made by judging the “quality” of the rally as it unfolds.
By “quality”, we mean measuring factors like the breadth associated with the rally (how many stocks were participating, e.g., the Advance-Decline Line), the pace of the rally (how quickly it could retrace the preceding losses), as well as sentiment (would investors be too quick to shift to bullishness or maintain a “healthy” skepticism). As it unfolded, based on these metrics, we judged the quality of the rally to be very good. The pace of advance was swift, the participation among stocks was excellent and investors were slow to believe in the rally, at least not to an unhealthy level.
In early April, however, the rally hit a wall as most of the major averages and sectors ran into significant resistance levels. At that point, the former relative strength leaders, i.e., the defensive sectors like consumer staples and utilities, etc. were quite extended already. On the other hand, while they were not at all extended on a longer-term basis, the formerly lagging areas of the market (e.g., commodity-related sectors, high-beta, international markets, etc.) had rallied up to significant resistance of their own. The question was, would this be the end of the road for these laggards, suggesting the move was merely a mean-reversion bounce in those areas of the market?
This was a key question as it could determine whether the rally had run its course, or was
simply set for a pause before continuing higher. And one development that would go a long way toward the “just a pause” scenario would be a breakthrough of resistance levels among these beaten-down and speculative laggards. Such a development would suggest the potential of a rotation of new leadership from the more defensive areas to the more “risk-on” areas of the market. This could give the rally the jolt of energy needed to propel it on to a new, more durable leg of advance.
In early to mid-April, many of these speculative laggards were indeed successful in breaking above the former lines of resistance. This brought an immediate jolt to the market, lifting stocks to new rally highs over the next few weeks. It also brings the potential for a further, more significant extension of the rally, if these areas can hold up.
Here are a few examples of laggard breakouts that have the potential to provide more rotational fuel to the rally.
Oil Stocks
If there is one sector that holds the key to the “rally is over” vs. “just a pause” consideration, it is oil stocks. They, of course, led the way lower over the past year and now have the chance to lead the way higher. Like several of the other former laggards, oil stocks (represented here by the NYSE Oil & Gas Index, XOI) broke above key resistance in mid-April, leading to a further pop in equities.
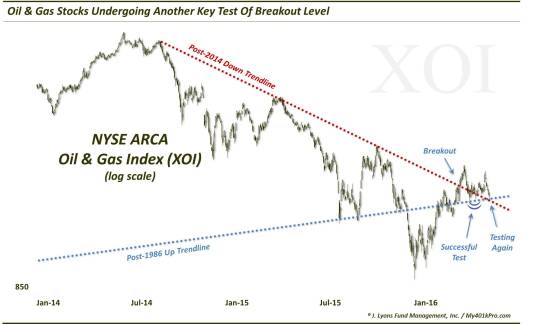
In the April-May pullback, the group retreated to test its breakout point. The test proved successful, leading to a short-term bounce. However, the sector was unable to climb to a comfortable distance above the breakout area and has presently returned to test the breakout level once again. Thus, these developments bear close monitoring. The reaction of oil stocks here could go a long way toward determining the potential for further upside to the rally.
High-Beta
One formerly lagging area whose fuel would be greatly appreciated by stock bulls is the high beta category. The behavior of these stocks can instruct us as to the willingness of investors to take on risk. If high beta stocks are rallying, “risk-on” is in effect. Conversely, if high beta stocks are floundering, investors are more likely concerned with protecting their capital, i.e., “risk-off”. This area (as represented by the S&P 500 High Beta ETF, SPHB) also broke above resistance in April.
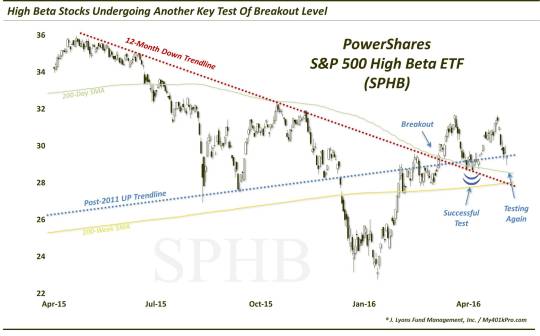
Like the oil sector, high-beta stocks pulled back to successfully test the breakout level last month. This group responded in an even stronger fashion to the test than did oil stocks. Even still, the group is also in the process of testing that breakout level once again. We will continue to monitor this high beta area for clues pointing to either risk-on or risk-off.
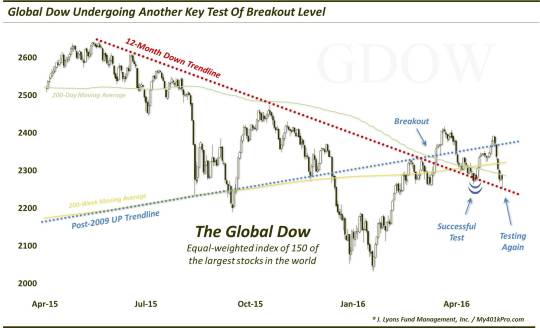
Global Stocks
Lastly, outside of brief periods here and there, we have seen U.S. stocks lead the way higher in
recent years. It is doubtful that the U.S. can continue to bear this burden of carrying the rest of the world. Sooner or later, other global markets will need to shoulder some of the weight. We can see in the chart of the Global Dow index below that global stocks have been in a pronounced downtrend for the past year, even as the U.S. market has generally moved sideways. In April, we did see global stocks jump on board and participate in this rally as the Global Dow jumped above significant resistance. Again, this provided some needed juice to the market when it was slowing.
Like the other sectors mentioned, the Global Dow also pulled back to successfully test its breakout level in May. However, as with the oil and high beta stocks, the Global Dow has also pulled back to test the breakout level once again.
In the longer-term, obviously these breakouts among the laggards are only meaningful if they can be sustained. Therefore, it may not be overstating things to say that the longer-term potential of the post-February stock market rally, in general, may very well depend on the ability of these areas to successfully defend their breakout levels once again. A failure of these former laggards to hold here could suggest the end of the line for the rally as these areas that appeared ready to fuel another leg up in the rally proved to be out of gas. On the other hand, a successful hold may enable these sectors to re-engage their rally and lead another risk-on advance in stocks.
There are certainly other recent positives like the expansion in new highs and various examples of extremely bearish sentiment would appear to add weight to the “stay of execution” argument. Thus, just maybe the bull market is not quite through running higher – even if it faces eventual slaughter.
Skeptical Sentiment
Another area whose behavior has unfolded in a constructive manner since the February stock market low is sentiment. Ideally, in order to prolong the life of a rally, bulls would like to see widespread disbelief among investors as a rally ensues. And as an advance progresses, a slowly gathering acceptance of rising prices brings new money to the market in a more durable fashion. As long as the bullishness doesn’t get too extreme, there presumably remains more money, i.e., more potential fuel, left to extend the rally. This has been the case during the post-February rally. At its early stages, traders were extremely skeptical. In the months since, sentiment indicators – both survey-based and real money – have fluctuated between mildly bullish and wildly bearish. For the most part, readings have been conducive to further rising prices. If anything, there have been some examples of unprecedentedly bearish sentiment, given the circumstances, that have left us scratching our heads.
Surveys
Among the various surveys of investor sentiment, most have been very slow to see a rise in
bullishness since the February low. Yes, there are some fringe surveys that have seen sentiment get a bit over-heated in recent weeks. However, for the most part, investors’ proclaimed bullishness has, at best, collectively reached the neutral mark. And in some cases, bullishness has remained extremely subdued – even to record levels – relative to the action in the stock market. One example of this is in the popular American Association of Individual Investors (AAII) survey.
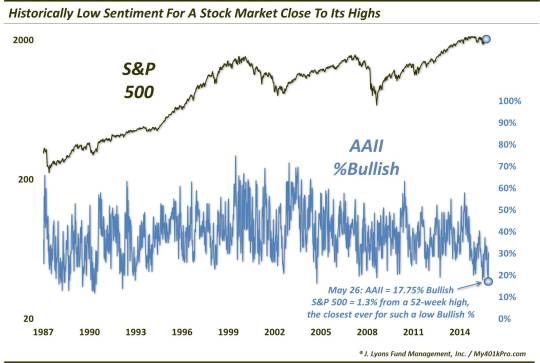
As of late May, AAII bullishness remained surprisingly low given the rally. In fact, the 17.75%
bullish reading on May 26 was unprecedentedly low relative to the S&P 500’s proximity to its 52-week high – just 1.3% away. This skepticism is an indication of further potential fuel for the rally. Although, bullishness does need to rise as an indication that investors are indeed coming back into the market. And while the readings have risen slowly since late May, they are still
very low on a relative basis.
Real Money
While surveys are interesting, and often helpful, in gauging how the collective investor
community is thinking, we prefer real-money indicators in determining actual market sentiment. People can say whatever they want. However, what they do with their money is much more revealing from a sentiment standpoint. And, for the most part, real-money gauges have also been relatively subdued during the rally. Similar to the AAII behavior, some have even displayed extreme bearishness considering the moderate losses at any point in the post-February rally.
A case in point comes from the equity options market. Back in mid-May, traders in CBOE equity options were busy buying up puts in large numbers relative to calls. In fact, the 10-day average of the CBOE Equity options Put/Call ratio reached over 0.8% for just the 18th time since 2003. Of all 18 of those occurrences, this one transpired with the smallest drawdown of the S&P 500 from its 3-month high (-1.8%). As a matter of fact, the previous 17 occurred with the index a median -9.4% away from its high.
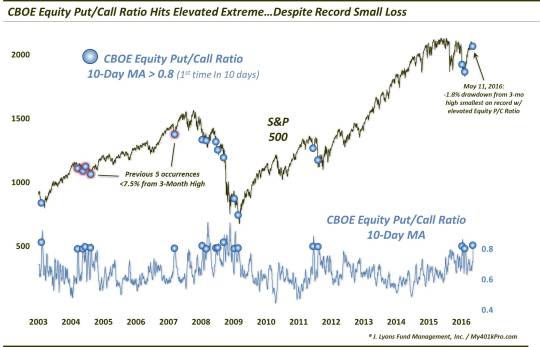
Prior readings of such elevated CBOE Equity Put/Call readings, i.e., elevated hedging, saw mixed returns in the stock market going forward. However, that is mainly due to those readings occurring during the 2008-2009 bear market. Outside of those, and particularly among the readings occurring while the S&P 500 was relatively near to its 52-week high, stocks showed a consistent tendency to rally in the short to intermediate-term. Indeed, this is one data point that has already seen some of its bullish ramifications manifested. The S&P 500 bounced some 4% in the weeks following the extremely high Put/Call reading. But while short-term readings have since cycled down to relative bullish extremes, on a longer-term basis there is plenty of room for an additional increase in bullishness in the options market.
Volatility
One wild card recently among indicators that we track comes from the volatility market. And we do mean wild. As with the equity options market, we have noticed an elevated degree of hedging lately in the volatility market as traders have positioned themselves in anticipation of an increase in volatility. Interestingly, we have found some evidence that the volatility market is unlike most markets wherein extreme readings can reliably be faded given that the crowd is typically wrong at extremes. Indeed, when volatility positioning has moved to an extreme, it has not been uncommon for volatility itself to trend that way, at least in the short-term. Thus, there has been a “smart money” component to the volatility market. And we saw that dynamic play out in spades recently.
In another example of unprecedented behavior, volatility traders were handsomely rewarded for their relatively out-sized hedges over the past week as the S&P 500 Volatility Index (VIX) soared by a record amount, relative to the mild stock market decline. On a 1-day, 2-day and 1-week basis, VIX has never jumped as high as it did recently without a more significant decline in the S&P 500.
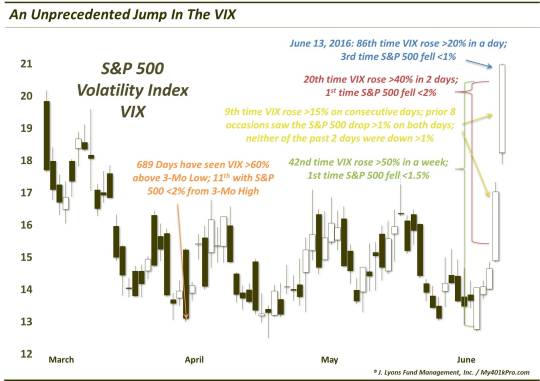
Is this record jump in the VIX a harbinger of ominous things to come in the stock market? Or are traders getting ahead of themselves given the stock market’s relatively close proximity still to its highs? Our guess is that the “smart money” volatility dynamic has already played itself out. That is, inasmuch as we could reasonably expect, the recent rise in volatility expectations has already rewarded those who were positioned for it. Any further rise in the VIX could likely not be explained by the recent high level of trader hedging.
That said, from a sentiment basis, it is still a bit difficult to depend on stocks bouncing and the VIX dropping from here. We have attempted to isolate historically similar moves to what we just witnessed in the VIX. To the extent that these historical comparisons are applicable, stocks should rebound some in the short to intermediate-term. Even more so, the VIX should be expected to retreat over that time frame. However, when dealing with truly unprecedented events, it is difficult to hang one’s hat on an “expected” outcome.
Conclusion
All of our analysis over the past 12-18 months has been consistent with our expectations of a
significant cyclical top developing in the broad stock market. The post-2000 secular excesses that remained inadequately repaired appear poised, in our view, to undergo that process. At the same time, tops can be long, drawn-out processes. And the more substantial the top, the more drawn-out the process can be. Thus, the timing of a market top is one of the more difficult challenges for an investor.
This point has been driven home during the post-February bounce in the stock market. The cyclical top appeared to be unfolding remarkably on schedule following the internal market deterioration last year, and the subsequent breakdown in prices into early 2016. However, one has to always maintain an open mind regarding the potential movement in financial markets. As such, the quality of the expected “bear market rally” off of the February lows has exceeded our relatively moderate expectations. The breadth has for the most part been excellent, the momentum very good and sentiment constructively skeptical. All of those factors have produced a more impressive rally than we would have predicted in mid-February.
So how much of the elevated expectations due to the high-quality nature of the rally have been realized? From a breadth perspective, the new high in the NYSE Advance-Decline line should give one pause about ruling out a new high in stocks, at least in the S&P 500. That said, our research has just recently begun to detect the first cracks in the previously superb breadth situation. In terms of momentum, the reliable bullish expectations based upon the thrust off of the February low have likely run their course. That said, a further extension of the rally based on similar historical thrusts cannot be ruled out, and indeed is probably as likely to occur as not. Much of that may depend on the key tests in those former laggard groups that provided an extra boost to the rally in recent months. And from a sentiment standpoint, there is substantial upside potential based on still-depressed readings. However, that potential will only pay dividends if it becomes realized and market participants begin to become more bullish.
Our expectations of a developing significant market top have not changed as a result of the
impressive post-February rally. The bounce, in our view, is likely still consistent with a “bear market rally”. Thus, while it may extend further still, it is unlikely to be sustainable in the end. In legal terms, a “stay of execution” is defined as “a delay in carrying out a court order”. It does not terminate the order. As such, while the ultimate demise of the bull market may have been postponed temporarily, it is still on schedule for slaughter.
Dana Lyons
Partner
The commentary included in this newsletter is provided for informational
purposes only. It does not constitute a recommendation to invest in any
specific investment product or service. Proper due diligence should be
performed before investing in any investment vehicle. There is a risk of loss
involved in all investments.
Copyright © 2016 J. Lyons Fund Management, Inc. All
rights reserved.
__________
More from Dana Lyons, JLFMI and My401kPro.

