Stock Burst To New Highs Just The Beginning, Or Final Hurrah?

The S&P 500 just experienced an unprecedented burst to new high ground; will the move prove to be exhaustive or propel the index even higher?
On Friday, we discussed the S&P 500′s long awaited new 52-week high. Besides the fact that it had been more than a year since its last 52-week high, the manner in which it arrived into new high ground was also interesting. The index didn’t merely stroll into a new high, but it burst there in an unprecedented show of strength. Specifically, on Friday, the NYSE saw more than 95% of its volume go towards advancing stocks. That was the first time the S&P 500 made a new high on such strong upside volume. In fact, it was just the 9th time since 1965 that a 52-week high was accompanied by more than 90% advancing NYSE volume.

We’ve discussed 90% Up Days several times in the past. On the one hand, when occurring just off of multi-month lows, they have often kicked off more durable rallies (arguably applicable in present circumstances). On the other hand, when occurring near highs, they have at times served as exhaustive moves, at least in the near-term (also arguably applicable in present circumstances). So which will it be – a springboard or a last hurrah? Maybe it’ll be both.
Looking at the aftermath of the prior 8 52-week highs occurring with 90% Up NYSE volume since 1965, we find the following performance by the S&P 500.
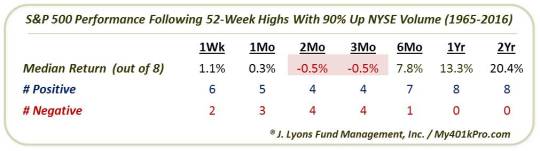
Now, obviously 8 events in 50 years is a tiny sample size. It’s one of the reasons we featured this as our Chart Of The Day. However, it does not exactly lend itself to statistically significant guideposts. That said, based on the precedents we do have, the general pattern has been for the S&P 500 to show some follow-through to the upside in the very short-term. After that, it has been a toss-up in the intermediate-term of 2-3 months with the former events actually showing a negative median return.
In the longer-term, though, the results get substantially positive, mirroring those that we looked at on Friday. Just once was the S&P 500 negative 6 months later. And 1 and 2 years following the events, the index was higher every time. Again, it’s only a 1-day event and the sample size is very small; however, the data that we do have would seem to bode well for stocks in the longer-term.
One other interesting bit of market symmetry related to this development took place almost exactly one year ago. In a post from July 21, 2015 titled “The Thinnest New High In Stock Market History”, we documented the egregiously poor breadth accompanying the July 20 52-week high in the Nasdaq and near-high in the S&P 500. Our contention was that the market’s thinning internal foundation did not bode well for the market going forward. Indeed, the Nasdaq has yet to eclipse that July 20, 2015 high and the S&P 500 failed to top its July 20 close until last Friday.
One of the pieces of “thinning” evidence in that post from last year dealt with NYSE volume. Specifically, even though the S&P 500 closed higher on both July 17 and July 20, 2015 to within 0.2% of a 52-week high, Up volume on the NYSE on those days was 28.2% and 29.4%, respectively. Those 2 readings marked the lowest % of Up volume EVER (back to 1965) on a day the S&P 500 closed higher to within 0.5% of a 52-week high. That’s out of 1567 such days, by the way. Fast forward to this past Friday and we find the highest % (95.1%) of Up volume EVER on such a day.
While that year-old data point may have nothing to do with what transpires from here on out, it is a helpful contrast to keep in mind when pondering the market’s structural soundness as it hits new highs. Do the consistently solid long-term results following 90% Up volume days to new highs have any statistical bearing on our present circumstances? We’d like to give that nod to the bulls, but it’s probably a bit of a reach for a single day data point. The shorter-term results, if anything, are likely more relevant, and those are a toss-up at best.
At a minimum, though, based on internal measures, we are confident that the market stands a much better chance of extending its rally in the near-term than it did a year ago.
_____________
More from Dana Lyons, JLFMI and My401kPro.
The commentary included in this blog is provided for informational purposes only. It does not constitute a recommendation to invest in any specific investment product or service. Proper due diligence should be performed before investing in any investment vehicle. There is a risk of loss involved in all investments.


