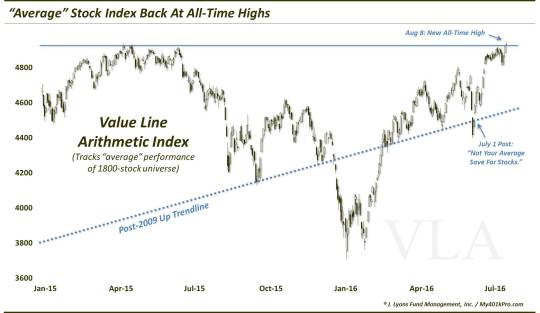
A Big Victory For The “Average” Stock
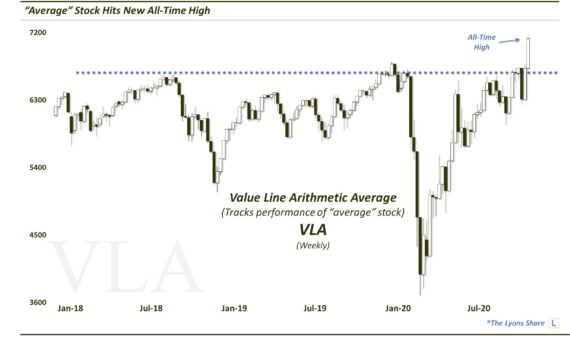
An index tracking “average stock performance” just achieved an important milestone, surpassing its 2015 all-time high.
In what is not our first and, apologetically, likely not our last Olympic metaphor, a key broad market index has rallied from the brink of defeat just 6 weeks ago back into the winner’s circle. The index is called the Value Line Arithmetic Index (VLA) and it tracks essentially the average performance of a universe of approximately 1800 stocks. So it is a solid gauge of the health of the broad U.S. equity market. We last mentioned the index amidst the Brexit aftermath in early July. During the immediate post-Brexit reaction, the VLA suffered a wicked decline along with most areas of the equity market. In the process, it temporarily broke below the post-2009 Up trendline that had supported it for 7 years, outside of January and February of this year. However, as we mentioned in the July post, by the end of that week, the VLA had staged a furious rally to again reclaim the top side of the trendline.
And while that week marked the comeback that put the VLA back into the race, yesterday was perhaps the finish line (at least, in this analogy), as the index finally made it back to all-time highs, surpassing its April 2015 peak.
Why is this important? First, it underscores one of the themes we have consistently alluded to since early on in the post-February rally: strong market participation, or breadth. One of our firm’s investment philosophies is to try to align our investment posture with that of the broad market of stocks rather than just a narrow, cap-weighted, large-cap average, for example. Therefore, various measures of breadth are very important in our risk assessment of the market.
Along those lines, market breadth has remained stellar all throughout the post-February rally. This condition has provided the cover to maintain a much higher level of equity exposure during this summer’s rally. This is in particular contrast to last summer’s historic internal deterioration in the face of the large cap rally.
Secondly, we have long held that the action of the past 16 months or so has been part of a cyclical topping process in the stock market. Consistent with that thinking is the notion that the post-February rally would be a “bear market” rally. That is, while it may be a substantial bounce, it would not result in a new up-leg in the overall market, outside of a select few areas. Included in those select few areas, as we have been suggesting during most of the rally, would likely be the large-cap averages and defensive sectors. And those market segments have indeed gone on to new highs.
However, we have also seen other areas move to new highs recently including assorted cyclicals and, now, broad market averages like the VLA and the Wilshire 5000. Additionally, we saw the NYSE Advance-Decline Line move to new highs in April and it continues to make new highs. These are important developments in that they suggest, at a minimum, that any substantial damage of a cyclical nature is at least not imminent. Furthermore, while the decline from summer 2015 into early 2016 had looked like a potential kickoff to a cyclical bear market, that does not appear to be the case now.
So this means we are throwing in the towel on the notion of a “topping process” and a “bear market rally”, right? Not necessarily. Our view is that the evidence, from last year’s internal deterioration to longer-term, excessive “background” metrics, etc., still suggests we are in the midst of a sort of transitional topping process. Furthermore, other broad market averages are still well below their former highs. These include the NYSE Composite as well as our favorite broad market measure, the Value Line Geometric Composite (VLG). The VLG, which we have mentioned on many occasions, is the sister index to the VLA and measures the “median” stock performance of the same 1800 stock universe. Presently, the VLG is still 8% below its 2015 highs.
Even if the interpretation of a topping process is accurate, however, such a process can be a lengthy, drawn-out affair. And recent positive developments, like the move to new highs by the VLA, suggest that the end to such a potential process is not nigh.
_____________
More from Dana Lyons, JLFMI and My401kPro.
The commentary included in this blog is provided for informational purposes only. It does not constitute a recommendation to invest in any specific investment product or service. Proper due diligence should be performed before investing in any investment vehicle. There is a risk of loss involved in all investments.