Global Equity Rally Facing Next Big Hurdle

A key index of global equities is hitting a significant confluence of chart resistance.
Back in early April, the global equity rally began to look a bit tired after 2 months of rallying. This was especially the case in the major U.S. averages and defensive sectors that had been bearing the brunt of the advance. Shortly thereafter, we saw a number of previously lagging areas of the market break out above key resistance that had been holding them back. This gave the rally some new fuel and propelled stocks higher for a couple more weeks before pausing.
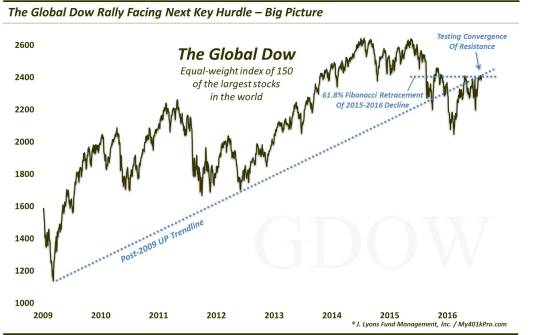
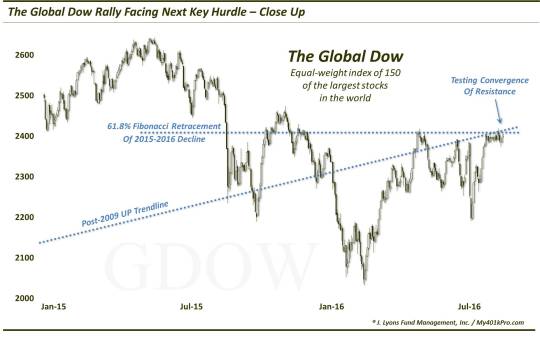
Included among this “new fuel” were global stocks, which had been lagging for some time. And a barometer of global stocks that we like to monitor, the Global Dow Index (GDOW), was able to achieve one of the aforementioned breakouts. In the process, the GDOW jumped above a plethora of key resistance levels, including the post-2009 Up trendline as well as the post-2015 Down trendline. After following through on the breakout for a few weeks, the GDOW was halted at another key level of resistance: the 61.8% Fibonacci Retracement of the May 2015 – February 2016 decline at 2412 (the GDOW closed at 2410 on April 20).
While the GDOW has been unable to surpass this level since, it has also managed to avoid breaking down. And after a handful of attempts to break the index lower, it has once again returned to the former Fibonacci line at 2412 that held it in check in April. If it can finally overcome this level, it could spur on another leg up in the global equity rally. There is one other item of resistance that may make this area an especially tough hurdle this time, though.
At the time of the April breakout, as mentioned, one of the lines that the GDOW was able to overcome was the up-sloping trendline from the index’s 2009 lows. After breaking below the trendline in January, it was able to again reclaim the top of it in April. After the rally stalled later in April, however, the index would again lose the trendline, falling back below it by early May. It has been below the trendline since. However, as the trendline is upward sloping, it has now risen to presently intersect with the Fibonacci Retracement near 2412.
Thus, as the chart shows, the GDOW is now contending with this convergence of the 2 key resistance lines in its attempt to hurdle to new rally highs (as we type, the index is trading at 2413).
Here’s a closer view of the current action.
With sentiment finally getting a bit frothy and U.S. stocks perhaps getting extended, the global equity rally could sorely use some fresh fuel again. As in April, if the laggard areas that aren’t as extended, like the Global Dow Index, can hurdle over current resistance, it could provide the rally with a much-needed jolt of energy.
_____________
More from Dana Lyons, JLFMI and My401kPro.
The commentary included in this blog is provided for informational purposes only. It does not constitute a recommendation to invest in any specific investment product or service. Proper due diligence should be performed before investing in any investment vehicle. There is a risk of loss involved in all investments.