REITs Fight To Maintain Key ‘Real Estate’ On Their Chart

After breaking out of a massive cup-&-handle formation last month, REITs have returned to test that breakout level.
Early on in the week, a theme has definitely begun to emerge: “tests”. No, not the “back to school” variety but tests on the charts of financial markets. By chart tests, we are simply referring to occasions in which prices revisit former levels of significance and either confirm or reject previous action. If prices hold the level and resume course in the same direction as their prior encounter with the area, we say the test was successful. However, if prices move through the level in question, the test is a failure.
Over the past week, we have noted key chart tests of all varieties and durations. Utilities are testing their breakout level of last spring while, as noted yesterday, German stocks are testing their breakout of just a few weeks ago. Somewhere in between, we have a plethora of sectors and markets, e.g., the S&P 500, that broke out above significant levels in early to mid-July. Some of these groups are returning now to test those important breakout levels. Included among them are Real Estate Investment Trusts, or REITs.
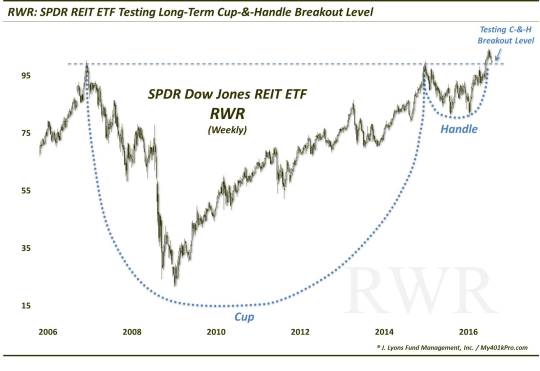
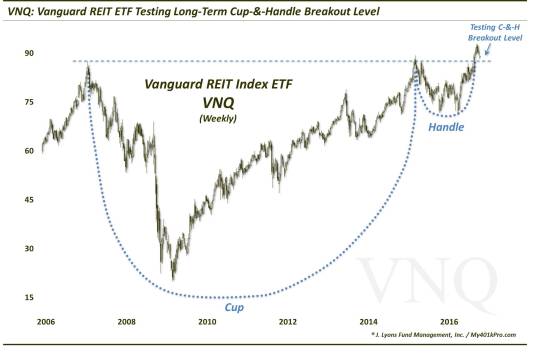
On July 12, we noted that one of the main REIT indices, the Dow Jones U.S. Select REIT Index was not only breaking out to all-time highs, but it was arguably emerging from a historically uber-bullish chart pattern as well. The chart pattern is a “cup-&-handle” and typically leads to meaningful moves higher upon breaking out above its former peaks. After the breakout, the index was able to follow through to the upside by about 4% over the next 3 weeks.
Over the past 3 weeks, however, REITs have done an about-face, steadily pulling back to the point where they are presently testing the level of their July breakout.

As we noted in the July post, 2 of the largest REIT ETF’s in the market were essentially tracking the index step for step. That continues to be the case. Here is the SPDR Dow Jones REIT ETF (RWR):

And here is the Vanguard REIT ETF (VNQ):

Like other similar posts recently, the game plan ought to be pretty simple regarding such a test. Should prices hold the breakout level, longs should have the advantage. And considering, again, the cup-&-handle pattern from which this breakout came, with a successful test under the belt, REITs could have extensive upside potential. On the other hand, should prices be unable to hold the breakout level, we’d be looking at a false breakout. And as we’ve seen plenty of times in recent years, false breakouts or breakdowns can lead to just as powerful a move in the opposite direction.
One “wildcard” in this instance may be S&P’s reclassification of real estate as its own sector beginning August 31, 2016. The decision to move real estate out of the financial sector has led to plenty of speculation as to what will transpire. We’re not about speculating, though. We prefer to analyze the charts and the data and make investment decisions based on objective, quantitative strategies. Our belief is that all market pertinent inputs will necessarily be filtered through the data and through prices on the charts. Thus, investors need only to concern themselves with what is happening in the charts and data, rather than what supposedly caused the happening.
Thus, in this case, regardless of the impact of the S&P reclassification, the only thing that matters in the immediate-term is that REITs successfully hold the territory near their July breakout.
_____________
More from Dana Lyons, JLFMI and My401kPro.
The commentary included in this blog is provided for informational purposes only. It does not constitute a recommendation to invest in any specific investment product or service. Proper due diligence should be performed before investing in any investment vehicle. There is a risk of loss involved in all investments.

