Post-Crisis Run In Muni Bonds Nearing End Of The Road?

Like many assets, muni bonds have enjoyed significant appreciation in recent years; that rally may be in jeopardy, however.
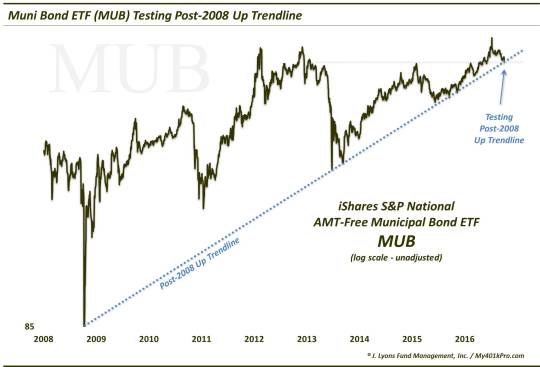
Seeing as though it’s Trendline Wednesday (see our streams on Twitter and StockTwits: @JLyonsFundMgmt), it is appropriate that our Chart Of The Day highlights a currently relevant trendline. And while it may not be the most significant data point in the financial markets, the chart does contain a rather exquisite trendline – for those of us who are into such things. The series in question pertains to municipal bonds, specifically, the iShares Municipal Bond ETF (ticker, MUB). MUB has been on a steady uptrend in price since it essentially crashed in 2008, along with most financial assets. This uptrend is squarely being tested at the moment.
As the chart shows, the Up trendline at play here begins at the October 2008 panic lows in the fund. Now, whether those low prints back then represent the accurate market at the time or skewed prints due to an illiquid market, we’re not sure. But we don’t care either. Valid trendlines have a way of materializing under normal or illiquid conditions. In this case, we drew a trendline on an unadjusted log scale chart of the MUB beginning at those 2008 lows and connecting the June 2013 “taper tantrum” and September 2013 lows. Extending it further, the trendline precisely connects the September and November 2015 lows as well.
Guess where the trendline is intersecting right now. Yes, right at current prices, just above the 112 level.
As we often say, when the frequency of trendline touches increases, so do the odds of the trendline breaking. With the multiple touches over the past year, this trendline may be in jeopardy of breaking. If it does, the loss of upside momentum and support would certainly be a negative for muni bond bulls.
It wouldn’t automatically mean the post-2008 bull market is over, nor that a sizable correction is assured. However, a break of the trend would likely usher in some selling pressure in the short-term and probably some sideways consolidation, at least, in the intermediate-term. At a minimum, the trajectory of the rally will necessarily be shallower.
One factor that may help the MUB continue to hold this trendline, for now, is potential support stemming from the fund’s springtime breakout. As we posted at that time, the MUB was arguably breaking out of a cup-&-handle formation (2 of them, in fact), a pattern with bullish ramifications. The resultant breakout saw the MUB follow through by a couple percentage points into mid-summer. Since July, however, MUB has been on a steady retreat that has now brought it to the level of its spring breakout – just above 112. This added measure of support here suggests the MUB may, at least temporarily, hold its post-2008 Up trendline.
Eventually, however, we have doubts about the likelihood of MUB maintaining residence above the trendline. The increasing frequency of trendline touches and MUB’s inability to mount much of a lift anymore off of the trendline points to a pending breakdown. We’re not calling for a collapse of the muni bond market off of an ETF trendline break. After all, if any market truly is “local”, it is muni bonds. However, the MUB does have a fairly high correlation to the broad muni market. Thus, a breakdown below this trendline may possibly spell the end of the road for this recent run in munis.
_____________
More from Dana Lyons, JLFMI and My401kPro.
The commentary included in this blog is provided for informational purposes only. It does not constitute a recommendation to invest in any specific investment product or service. Proper due diligence should be performed before investing in any investment vehicle. There is a risk of loss involved in all investments.