Road Map Says Utility Stocks Better Stop Here

Utility stocks have been conforming very reliably to charting analysis; if that trend continues, the chart says they better stop dropping now.
We’ve discussed in the past that most technicians or chartists have a handful of stocks, indices, tickers, etc. that never seem to behave the way they’re “supposed to” according to the analysis. For me, one such miscreant has always been utilities stocks – the Dow Jones Utility Average, to be precise. The DJU always seemed to zig when I thought it should zag, and vice versa. For that reason, its recent behavior has been exceedingly interesting. That’s because, for about the past 6 months, the DJU has behaved exactly how our technical road map would suggest it should.
It started in March when the DJU began a healthy 12-week consolidation at the level of its January 2015 all-time highs near the mid-650′s. That was followed by a textbook breakout to new highs. The breakout would see follow-through into early July, when we noted on Twitter and StockTwits (follow us on both: @JLyonsFundMgmt) that the DJU rally was hitting the vicinity of 2 noteworthy Fibonacci Extensions in the mid-720′s. Specifically, they were the 161.8% Fibonacci Extensions of the two most significant DJU declines of the past decade, in 2008-2009 and 2015. Indeed, the rally would peter out at 724.
In the subsequent decline, we began posting about how the DJU was precisely following the technical “road map” laid out by its chart. In an August post, we indicated that the latest signs on this map appeared to be pointing to a test of the former breakout level. Specifically, we said that if “the index holds above 670-ish, the road should lead higher. Although, a detour toward the low-650′s level that marked the breakout of the January 2015 highs would not be a shock.” The index would bottom out at 656 in the early-September selloff.
In the mid-August post, we noted that “on the upside, the index may run into a roadblock in the low-700′s”. A week ago, the DJU reached nearly 699 before being turned back forcefully. As of this morning, the index had dropped 6% and was back down testing the ultra-important 655 area again. In our view, it best be bouncing here.
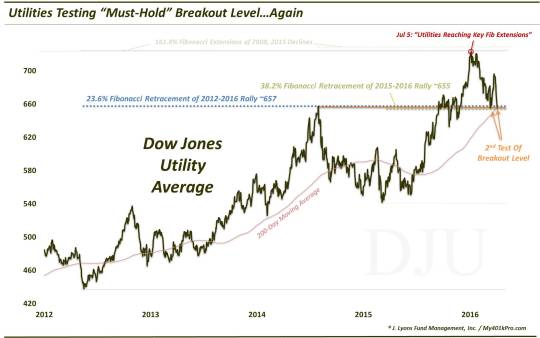
As the chart indicates, not only does this 655 area signify the breakout level, it is also represented
(not surprisingly)
by several other key levels. These include:
- The 23.6% Fibonacci Retracement of 2012-2016 Rally
- The 38.2% Fibonacci Retracement of 2015-2016 Rally
- The 200-Day Simple Moving Average
This is pretty substantial support for the DJU in the 650′s. If it can hold, this 2nd “re-test” of the breakout area could offer a green light for a more durable up-leg in utilities. On the other hand, should the area fail to hold, all this action of the past 6 months may prove to be nothing more than a false breakout. In that case, the road signs may as well say “Bridge Out”.
________
More from Dana Lyons, JLFMI and My401kPro.
The commentary included in this blog is provided for informational purposes only. It does not constitute a recommendation to invest in any specific investment product or service. Proper due diligence should be performed before investing in any investment vehicle. There is a risk of loss involved in all investments.