Will It Be Trick Or Treat For Norwegian Stocks At Key Juncture?

Norway’s key stock index is on the cusp of all-time high ground; but will old ghosts come out again to haunt this market?
Most global equity markets have suffered at least minor setbacks of late, leaving them off of their recent highs. And across the pond in Europe, most indices are still well off of their 2015 highs. That, among other factors, makes our Chart Of The Day an interesting one. Norway’s stock market has not been immune to the financial troubles plaguing the continent. However, it, along with much of Northern Europe, has remained a bit more resilient than its Southern counterparts. It has also had more of a tendency than most of its neighbors to march to its own tune, thanks in large part to its ties to oil. It is likely due to those latter factors that has Norway’s Oslo Stock Exchange All Shares Index (OSEAX) in an unusual spot for a European index – testing all-time highs. This is not your ordinary test, however.
After breaking out above all-time highs near 600 back in early 2014, the OSEAX quickly tacked on another 100 points over the subsequent few months. After stalling near the 700 level, the index would retreat to test the 600 breakout level by the end of the year. It would hold the general breakout vicinity and by the spring of 2015, it would be back challenging the 700 level again. However, along with the rest of the global equity market, the OSEAX would be hit hard again in the late-2015 to early-2016 selloff. Again, the index found itself testing the 600 breakout level, even undercutting it by 50 points early in 2016. Yet, the OSEAX would bounce back strongly along with the rest of the global stock world. This 2nd apparently successful test of the 600 breakout level has put the index in place to again test its all-time highs near 700.
Now, normally we’d say that after perhaps some temporary consolidation near the 700 highs, Nowegian investors may be in for a treat, namely a breakout to all-time highs. Why? Because the oft-mentioned “triple top” is an overrated and seldom occurring phenomenon. The problem in the case of the OSEAX is that all you need to do is look to the left on the chart to find a textbook, and ominous, example of one back in 2007-2008.
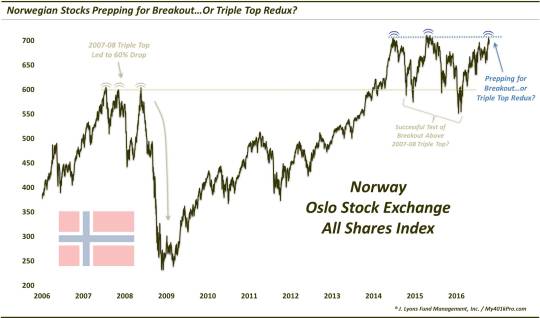
The aforementioned highs near 600 occurred as a result of a rare and perfect triple top in the OSEAX between July 2007 and May 2008. It was ominous in that it preceded a 60% drop in the index coinciding with the financial crisis. Another such result would obviously be a nasty “trick” played on investors. Now we are not suggesting that the 2007-2008 scenario has to necessarily play out again here. Indeed, just because a triple top occurred previously in the OSEAX index doesn’t make the rare phenomenon more likely to occur again now. Or does it?
We don’t know which way this scenario will play out. The good thing is that traders in this index have a distinct level in which to guide their decisions. Above roughly the 710 level, traders will be “treated” to all-time highs in which the sky’s the limit. Failing to break above that level and profits will be very “tricky” to come by.
________
More from Dana Lyons, JLFMI and My401kPro.
The commentary included in this blog is provided for informational purposes only. It does not constitute a recommendation to invest in any specific investment product or service. Proper due diligence should be performed before investing in any investment vehicle. There is a risk of loss involved in all investments.