Investors (Over?-)Prepared For Election Volatility

Despite an unseasonably calm stock market, relative near-term volatility expectations have jumped to the 3rd highest level in their 3-year history.
It’s no secret that we have maintained a cautious stance on the stock market in recent months. The main source of our concern has stemmed from the warnings from our intermediate-term Risk Model, which is driven substantially by a combination of market breadth, momentum and investor flows. Outside of our proprietary Model, another concern of ours has pertained to sentiment. Specifically, investors have generally been too complacent in recent months, at least according to the measures that we track. When such complacency abounds, the market becomes susceptible to a sizable decline as investors lack the protection that might serve as a cushion in the event of a small degree of selling. Events over the past week, however, have brought about a change to the sentiment picture.
First off, as we noted last week, some of the price damage that we’ve been expecting has begun to unfold, beginning with breakdowns in the small-caps and mid-caps. It hasn’t just been about price declines, however. We mentioned the term “events” intentionally. That’s because exogenous forces seem to be at work in raising the anxiety level among investors as well.
Why do we say this? Let’s look at the most popular stock market barometer, the S&P 500. While the large-cap index did close at a 3-month low today, it is only a mere 3.6% off of its all-time high. And yet, if we look at the relative near-term volatility expectations of the index – by comparing the 9-day VXST to the 1-month VIX – it is actually at its 3rd highest reading since its inception in 2013. Why is that? We’re guessing it is event risk – in the form of election-related headlines in addition to the election itself.
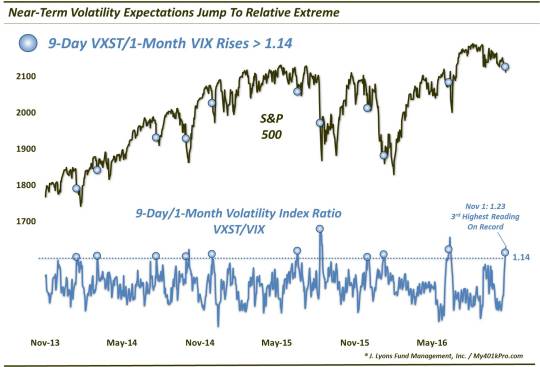
Now the election is just 5 market days away now. That puts it within the 9-day time frame covered by the VXST. And, in fact, the VXST/VIX ratio began to jump 4 days ago (while the S&P 500 was in the midst of a historically flat stretch, no less), which implies this jump in short-term volatility expectations is all about preparing for the election.
Now, normally our inclination upon seeing a sentiment reading at an extreme would be to fade it. After all, the crowd is notoriously wrong at extremes. However, the funny thing about this VXST/VIX indicator (and much of the volatility trade in general) is that the extremes are often warranted, at least in the short-term.
A prime example occurred just prior to the Brexit affair. We posted a similar piece as this one the day before the Brexit vote noting an extreme spike in the VIX/VXV (i.e., 1-month/3-month) ratio in the lead up. Considering the markets were relatively calm at the time, we wondered if investors were getting all worked up over nothing. As it turns out, the volatility traders were correct in their expectations, at least temporarily. While the markets eventually righted themselves, the Brexit vote initially ushered in a rash of knee jerk selling.
As we are wont to do, we looked at prior spikes in the VXST/VIX ratio to see how the market reacted. As it turns out, the Brexit incident was more the norm than an outlier. That is, more often than not, a spike to an extreme in the VXST/VIX ratio initially led to short-term weakness, prior to a rebound.
Specifically, we looked at all unique spikes above 1.14 in the VXST/VIX ratio. Since the inception of the VXST in 2013, there had been 10 prior such spikes before the current move. Here are the dates:
1/24/2014
3/14/2014
7/31/2014
10/9/2014
12/10/2014
6/29/2015
8/21/2015
12/11/2015
1/19/2016
6/20/2016
In most cases, the extreme jump in relative short-term volatility expectations presaged more selling pressure in the short-term. 8 of the 10 occurrences saw the S&P 500 lower at some point within the first week, with a median drawdown around -2% at some point within that first week. That’s 4 times the normal median weekly drawdown. That’s the (surprising) good news for bears.
The bad news for the bears is that the jump in short-term volatility expectations would not continue to pay off for long. In fact, after the rough first week, in a staggering turnaround, 9 of the 10 precedents would close higher by the end of week 2 – at a median return of +1.2%. Here are the aggregate numbers.
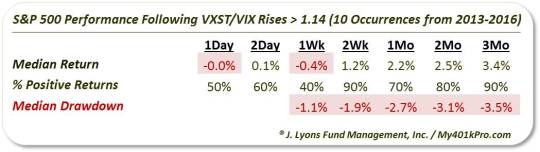
So as one can see, there is a little bit for both the bulls and the bears here.
Our knee jerk inclination that the spike to an extreme in the VXST/VIX ratio is likely a buy signal for stocks has not been the case, at least not immediately. These short-term volatility buyers have actually been “smart money” – just not for long. Following typical weakness during the first week following a signal, stocks had a strong tendency to bounce back in the intermediate-term.
Now, before you go out and load up on shorts, even for the short-term, we should emphasize one thing. While the ratio moved up to 1.23 today (November 1), the “> 1.14″ signal actually occurred yesterday (October 31) when the VXST/VIX ratio closed at 1.18. Therefore, with the S&P 500 trading as much as -1.3% today, much of the typical expected short-term drawdown has already transpired. That’s not to say there won’t be more weakness in the days ahead. However, the further weakness suggested by this signal has occurred already.
Therefore, volatility investors thus far have been justified in their pre-election preparedness. The question is how much more volatility should they be prepared for?
_____________
More from Dana Lyons, JLFMI and My401kPro.
The commentary included in this blog is provided for informational purposes only. It does not constitute a recommendation to invest in any specific investment product or service. Proper due diligence should be performed before investing in any investment vehicle. There is a risk of loss involved in all investments.

