Is Abundance Of New Highs AND New Lows A Bad Omen?

Instances of simultaneously elevated numbers of New Highs AND New Lows have led to poor stock market returns.
Today’s post piggybacks on Wednesday’s topic, i.e., the current large numbers of both New 52-Week Highs and 52-Week Lows on the stock exchanges. Those readers familiar with this topic likely gathered that our use of the word “omen” in the title of the post was not random. There is an infamous market indicator ominously called the “Hindenburg Omen”. And while there are several criteria involved in the HO, the main concept deals with large numbers of New Highs and New Lows at a given time. And although the HO is the object of plenty of Wall Street ridicule, that can probably partially be attributed to its eccentric name. Because when you dig into at least the concept behind the HO, which we have, there is a lot of evidence pointing to its validation.
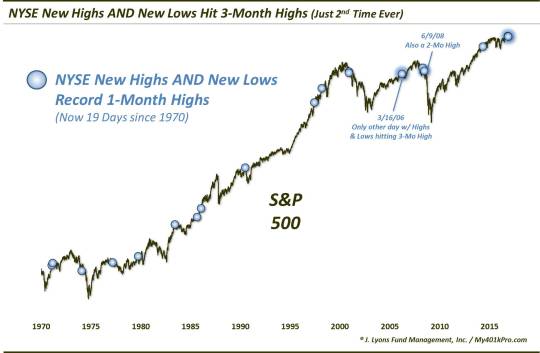
Today, we look at 2 unique milestones set yesterday dealing with the ramp up in both New Highs and New Lows on the NYSE. The first is the fact that both the number of New Highs and New Lows set 3-month highs yesterday. If that sounds odd, it is. In fact, it was only the 2nd day ever in which each set a 3-month high. And since 1970, only 18 prior days saw New Highs and New Lows set as much as a 1-month high.
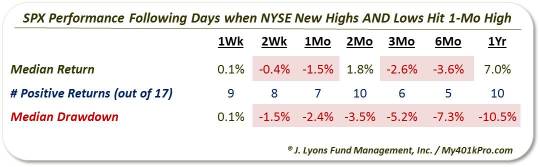
As with the Hindenburg Omen and our Wednesday’s look at the “Junkie Market”, i.e., too many highs and lows, the stock market has generally not fared too well in the intermediate-term following these instances. It hasn’t been unanimous. Some of the occurrences in the mid-80′s and mid-90′s saw the market keep moving higher without a hiccup. However, below-average returns were certainly the norm. Here are some of the numbers.
So obviously the number of NYSE New Highs and New Lows is relatively elevated. However, as the next data point shows, the level of New Highs and Lows is elevated on an absolute basis as well. To wit: Yesterday saw both the number of NYSE New Highs and New Lows account for more than 5% of all issues traded. That is another rare occurrence, with just 11 precedents since 1970.
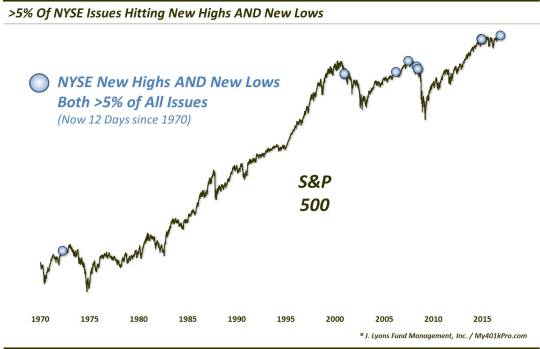
As one can see on the chart, all of the prior instances occurred in fairly close proximity to cyclical market tops (the jury is still out on the late 2014 occurrences). Thus, unlike the prior table, in a way, S&P 500 returns following these occurrences have been unanimously poor – at least over a 2-month time frame.
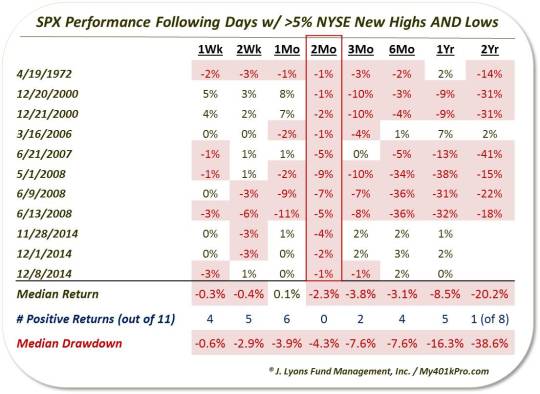
As the table shows, the return in the S&P 500 has been negative 2 months after all 11 occurrences. And it wasn’t just the 2-month period that was poor. Median returns are negative across nearly all time frames from 1 week to 2 years. The 2-year result is perhaps the most eye-opening after the 2-month. The market is not typically down over a 2-year period so to see 7 of the 8 instances lower is a rare result.
What causes the elevated numbers of New Highs and New Lows? And why would it necessarily be a negative for the stock market? We’re not sure, and we don’t really care. We’re never too concerned with the “why’s” when it comes to the markets. All we care about is what is happening. And for whatever reason, the market has been especially weak – and consistently so – following the occurrence of lots of New Highs and Lows. That is a legitimate red flag currently, in our view.
FYI, the blimp at the top of the post is the USS Akron. Since we understand, and share, the aversion to alarmist market language, we’ve come to call the 5% New High/New Low signal mentioned here “The Akron Omen”. It sounds less sinister than the Hindenburg Omen, although it still denotes caution and it pays respect to a lesser-known disaster. The USS Akron was a U.S. Navy helium-filled airship that crashed in April 1933 killing 73 airmen, twice the number of Hindenburg casualties. At the time, it was the greatest loss of life of any airship crash. It also is an appropriate way to remember our servicemen and women on this Veteran’s Day. Thank you to all who have served!
_____________
More from Dana Lyons, JLFMI and My401kPro.
The commentary included in this blog is provided for informational purposes only. It does not constitute a recommendation to invest in any specific investment product or service. Proper due diligence should be performed before investing in any investment vehicle. There is a risk of loss involved in all investments.


