Not Your ‘Average’ Test For Stocks Here

The “average stock” index is testing its post-2009 uptrend.
Some junctures are more significant than others in the markets. Coming into the week, it didn’t immediately occur to us that we were on the verge of such an important juncture across asset classes. However, the fact that our Trendline Wednesday feature on Twitter and StockTwits included an unprecedentedly large number of assets and indices suggests that we are indeed at a significant juncture.
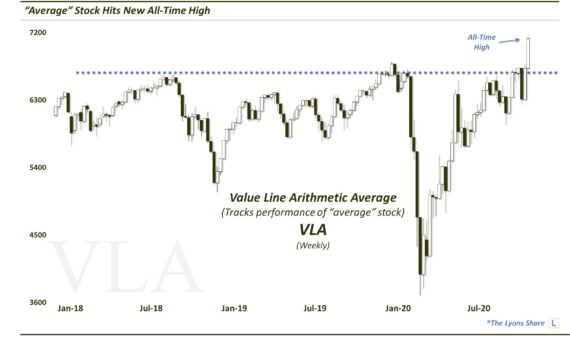
One such index pertaining to the equity market that we did not cover on Wednesday is the Value Line Arithmetic Index (VLA). It measures the “average performance” among a universe of roughly 1800 stocks. Because of its construction, it is an important barometer of the health of the overall market. The VLA’s present relevance here is due to the fact that it is testing its Up trendline stemming from the lows in 2009, currently around 4700.
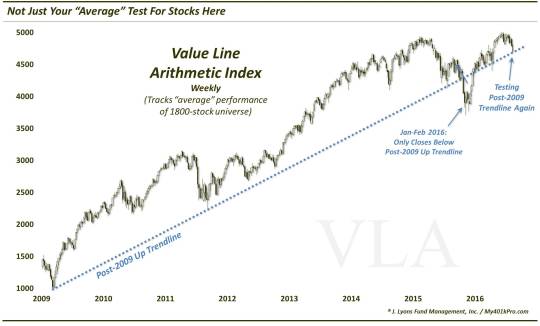
As illustrated in the weekly chart above, the trendline precisely connects the lows in October 2011 and September 2015. The trendline finally broke in January of this year, with the VLA subsequently spending 2 months below the line. However, by early March, the VLA recovered the top of the trendline. Since that point, the trendline has regained its relevance, providing support for the index on multiple occasions in March, April and May.
In June, following the Brexit vote, the VLA broke below the trendline again mid-week. However, as we mentioned at the time, the index would rally to close the week back above the trendline. So, since 2009, January and February 2016 still mark the only 2 months in which the VLA closed below the trendline. As mentioned, that streak is being tested at present.
Of a great many trendline tests across the U.S. equity market currently, this is among the most consequential. The VLA is an important gauge of the health of the broad market. Losing the post-2009 trendline would suggest that stocks, on average, have had their 7-year uptrend snapped. That’s not insignificant.
Now, if the trendline is broken, it doesn’t mean that the market has to necessarily tank. For one, it could come back and regain the trendline like it did in March – although, that feat isn’t likely to get repeated too many times. Furthermore, even if the VLA breaks the line, it may merely enter a sideways pattern rather than a significant correction. It is even possible that the index resumes its uptrend, albeit at a shallower trajectory. Still, those would be less desirable outcomes than having the VLA successfully hold the trendline.
Will it hold? We don’t have a crystal ball. With our proprietary risk indicators still firmly pointed lower, and coming off of elevated levels, there is a case to be made for lower prices. Then again, as we discussed on Tuesday and Thursday, the short-term sentiment picture has shifted completely and could easily support a bounce.
So this one could go either way. And considering the importance of this index, it pays to keep close attention on the 4700 level in the VLA.
_____________
More from Dana Lyons, JLFMI and My401kPro.
The commentary included in this blog is provided for informational purposes only. It does not constitute a recommendation to invest in any specific investment product or service. Proper due diligence should be performed before investing in any investment vehicle. There is a risk of loss involved in all investments.