Traders Getting A Little Too Comfortable In Stocks?

Near-term volatility expectations have plunged to record lows.
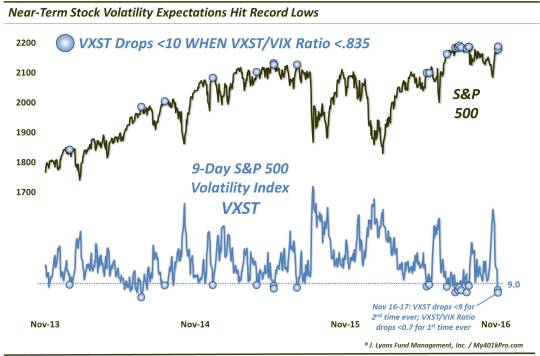
Trader sentiment has officially come full circle following the election. On November 1, we observed that “Investors Are (Over?-)Prepared For Election Volatility”. Our evidence was that the 9-Day S&P 500 Volatility Index (VXST) was trading at near-record levels relative to the 1-Month Volatility Index (VIX). At its peak, the VXST/VIX Ratio would hit 1.35. That marked the 2nd highest reading in the VXST’s 3-year history, trailing only August 21, 2015 (when the S&P 500 was essentially crashing). We thought this reading to be quite odd considering the rather pedestrian decline in the market. As they often
temporarily
do, these traders indeed got the short-term volatility they were looking for (if only overnight on election night). But that volatility vanished as quickly as it arrived.
On November 11, 2 days after the election, we wrote a post titled “Traders Breath Unprecedented Sigh Of Relief Following Election”. The impetus here was the fact that the VXST/VIX ratio, as well as the VIX/VXV (3-Month VIX) ratio, each saw their largest daily drop ever on the November 9 election day. In other words, traders had seen their relative comfort level improve faster than any other date in history.
That was a week ago. Fast forward to today and we see that, not only have volatility expectations vastly improved on a relative basis, they are now testing all-time record lows on an absolute basis. The VXST, specifically, printed an 8-handle (8.98) for just the 2nd time in its history today. Furthermore, the VXST/VIX ratio closed at an all-time low yesterday, moving below 0.7 for the first time ever. That indicates that traders already had low relative volatility expectations for the near-term. And, clearly, their comfort level has come full circle since just prior to the election.
So what’s the point – besides the triviality of the cycle – or the lesson about traders’ inevitable comeuppance once they’ve become too prepared for volatility? Well, looking historically, the combination of an extremely low VXST and an extremely low VXST/VIX ratio has not been kind to the S&P 500, at least in the short-term.
Specifically, after these past 2 days, there have now been 21 days in the past 3 years in which the VXST dropped below 10 while the VXST/VIX ratio was less than 0.835.
To utter those famous last words, this time may be different, but as we mentioned, the S&P 500 demonstrated consistent struggles in the short-term following the previous 19 occurrences.
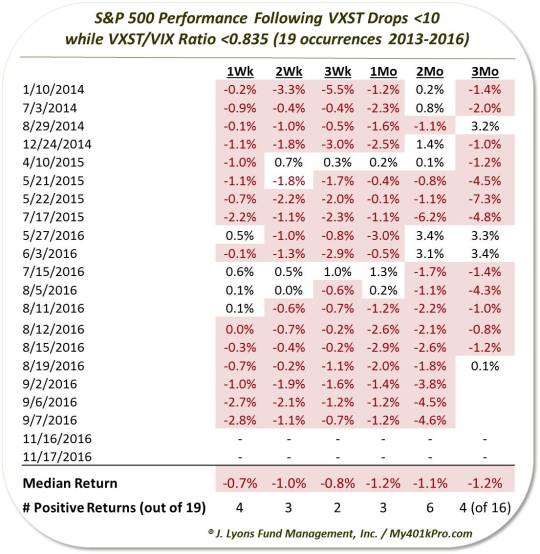
Some of the dates are clustered during this past August-September. But interestingly, they were mostly singular events, suggesting that these conditions are extreme, and unsustainably so. Therefore, whatever effects tend to occur as a result of such conditions, they tend to happen right away. Naturally, those include a rise in short-term volatility expectations and, as the table indicates, softness in stocks.
A week later, the S&P 500 was higher just 4 of 19 times, and it didn’t get any better after a month with just 3 winners. Even after 3 months, the 16 occurrences with enough data were lower three quarters of the time. The most consistently weak spot was 3 weeks following the readings. 17 of the 19 dates saw lower stock prices by then.
The consistency of the drawdowns (not shown) also jumps out. Within 2 weeks, 14 of the 19 occurrences had seen -1% drawdowns. By 1 month later, 15 of the 19 had experienced drawdowns of at least -2%.
That said, the weakness, while consistent, tended to be rather limited. For example, while 16 of the 19 days saw losses 1 month later, none of them were down even as much as 3% (unrounded). Even the drawdowns saw just 5 of the 19 down by as much as 3% at any point during the first month.
Certainly the limited magnitude of the losses has to do somewhat with the benign, range-bound environment that existed over most of this study period. Therefore, perhaps it’s just coincidence. And perhaps the losses following similar conditions as we are seeing now is just a coincidence. However, 17 losses out of 19 occurrences would suggest otherwise. It suggests that perhaps traders had just gotten a bit too comfortable with the stock market at those junctures, at least in the near-term.
And they have never been as comfortable as they are now.
________
More from Dana Lyons, JLFMI and My401kPro.
The commentary included in this blog is provided for informational purposes only. It does not constitute a recommendation to invest in any specific investment product or service. Proper due diligence should be performed before investing in any investment vehicle. There is a risk of loss involved in all investments.

