5 Most Viewed Posts (& Charts) Of 2016

These were the posts, and accompanying charts, that readers clicked on most in 2016.
As we wrap up 2016, we are looking back at the key moments, trends, stats and, of course, charts that defined the year in the financial markets. The following 5 posts and charts may not necessarily represent what we consider to be our most important posts or the most significant events of 2016. We will touch on that topic in an upcoming post on our “editor’s picks” for Charts Of The Year. However, these 5 posts received the most hits from readers this year on the JLFMI blog.
Interestingly, 4 of the 5 most viewed posts this year were from back in January of this year. Although, it was a tumultuous month so it makes sense that a lot of eyeballs were focused on the markets (at least we prefer to assign that as the reason for January’s popularity on the blog, rather than the possibility that our readers abandoned us following that month ;)). Additionally, 2 of the charts dealt with gold stocks, a topic that always generates a lot of interest.
We would be remiss if we didn’t acknowledge the fact that the clicks and views are largely a function of those outlets, such as YahooFinance, Marketwatch, See It Market, Zero Hedge, RealInvestmentAdvice.com, The Korelin Economics Report and others that have generously shared our charts and research throughout the year. We greatly appreciate everyone’s efforts in that regard. Thank you all for sharing – and reading!
Here are our Top 5 Most Viewed Posts & Charts of 2016 (click on the titles to read the posts):
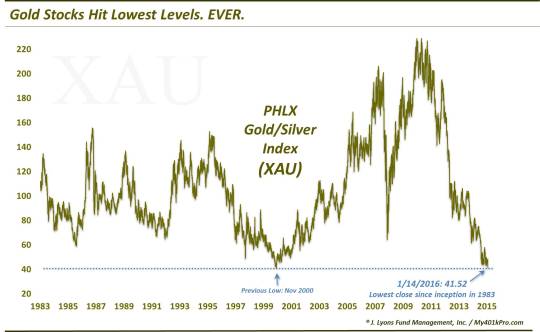
Gold Stocks Hit Lowest Levels. Ever.
“A popular gold equity index closed at the lowest level in its 30-year history today.” (UPDATE>>See #3 below.)
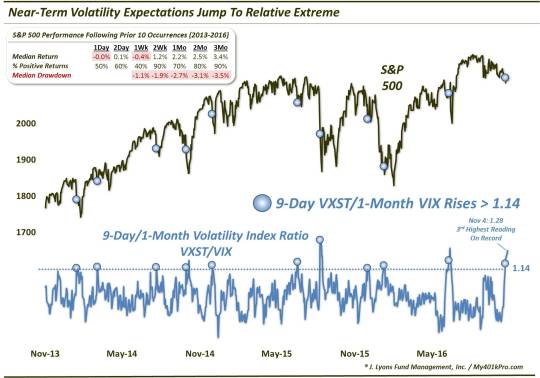
#4) Investors (Over?-)Prepared For Election Volatility – November 1
“Despite an unseasonably calm stock market, relative near-term volatility expectations have jumped to the 3rd highest level in their 3-year history.” (UPDATE>>Other than a wild ride on election night, investors did end up being over-prepared for volatility [as with Brexit] as stocks would launch a frenzied post-election rally back to new high ground.)
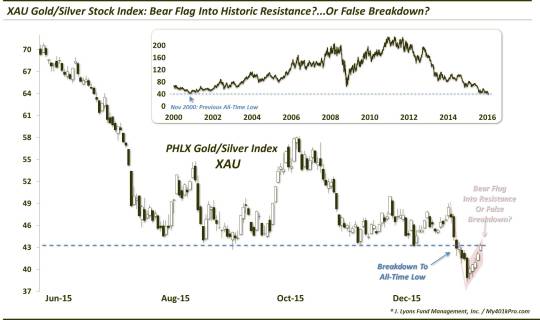
#3)
“Gold stocks are testing the level of their recent breakdown to all-time lows; will it be a false breakdown, or the start of a new leg down?” (UPDATE>>It was a false breakdown as the XAU subsequently nearly tripled over the next 6 months.)
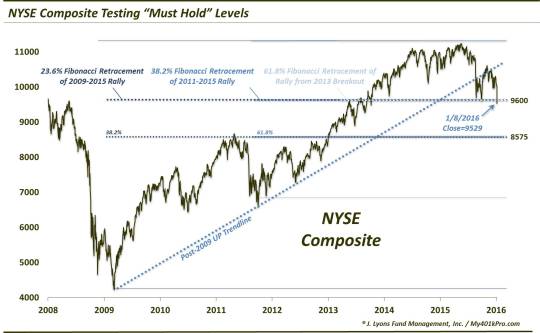
#2)
Broad Stock Market Index At “Must Hold” Level
– January 8
“The NYSE Composite’s bull market is on very thin ice.” (UPDATE>>The NYSE Comp would break its “must hold” level, leading to a further 7% drop over the subsequent week. However, BTBTD [Back To Buying The Dip] would come to the rescue as that dip would mark the NYSE’s low for the year.)
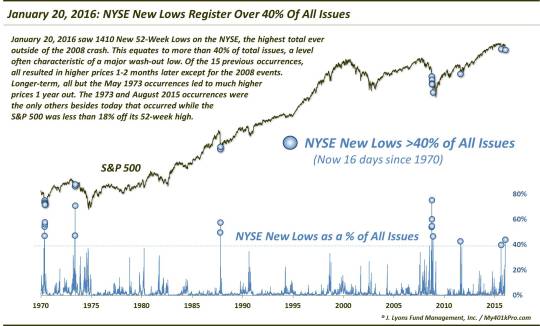
New Lows Hit ‘Wash-Out’ Territory
– January 21
“The number of New 52-Week Lows on the NYSE has reached levels historically consistent with a ‘washed-out’ market.” (UPDATE>>January 20 indeed marked the very low in the broad U.S. stock market for 2016.)
Thanks again for reading – and have a Happy New Year!
________
More from Dana Lyons, JLFMI and My401kPro.
The commentary included in this blog is provided for informational purposes only. It does not constitute a recommendation to invest in any specific investment product or service. Proper due diligence should be performed before investing in any investment vehicle. There is a risk of loss involved in all investments.