Stocks AND Volatility Indices Both Jump — Who’s Right?

Today saw the VIX solidly higher despite the fact that stocks rallied hard; what do similar precedents tell us?
Markets have been on a parade of peculiarity since the presidential election a month ago. Today’s rally on Wall Street was no exception. Yesterday, we noted the 3-month low in the S&P 500 Volatility Index (VIX), and the historically bullish connotations for the rest of December. Today, the VIX pulled an about-face, despite the strength in stocks. Specifically, the VIX uncharacteristically jumped 3.5% even though the S&P 500 (SPX) was up more than 1%. We thought that was odd so we looked at the historical data. It turns out that it was.
Since the VIX’s inception in 1986, today marks just 30th time in which the VIX rose at least 3.5% on a day that the S&P 500 gained at least 1%. 22 of those days occurred with the SPX within 2% of a 52-week high, as was the case today.
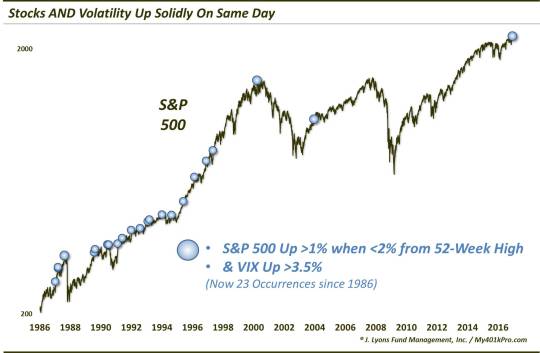
So, who’s right – stocks or volatility? Well, from a glance at the chart, there are a handful of glaring occurrences at cycle highs (e.g., August 1987, July 1990, March 2000). However, let’s look at the aggregate performance of the S&P 500 and the VIX following these 22 prior occurrence.
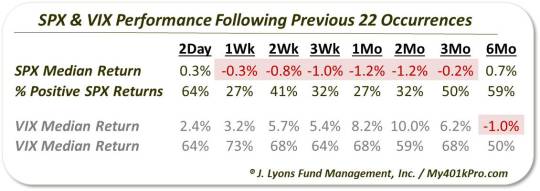
Prior precedents would suggest that the VIX is in the right here. The SPX saw median losses from 1 week to 3 months following previous occurrences, though median returns were never worse than -1.2%. The consistency of losses was the biggest offender, with almost ¾ of the events showing losses after a month and 1/3 after 2 months. Whatever effect this scenario had on forward performance, it seems to be a short to intermediate-term one. By the 6-month mark, median returns turned positive and began a path toward “normal” returns.
As for the VIX, the opposite occurred (predictably, as the VIX tends to move counter to stocks, today’s events notwithstanding). The VIX showed median gains from 2 days out to 3 months. Its peak median gain came at the 2-month mark at +10%. VIX gains were pretty consistent as well, with about 2/3 of the dates showing a rising VIX over all
durations, 2 days to 3 months. Again, by 6 months, the VIX seemed to settle down, posting a 1% median drop.
There are a lot of positive factors going for the stock market right now, not the least of which is price action. Therefore, we don’t want to make too much of this odd data point with its limited sample size. However, to the extent that this face-off between rising stocks and a rising VIX has any influence on future performance, historical precedents suggest it may be the stock market that blinks – at least in the shorter-term.
_____________
More from Dana Lyons, JLFMI and My401kPro.
The commentary included in this blog is provided for informational purposes only. It does not constitute a recommendation to invest in any specific investment product or service. Proper due diligence should be performed before investing in any investment vehicle. There is a risk of loss involved in all investments.

