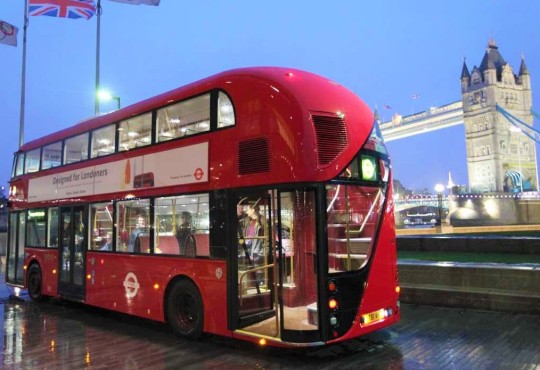
Another Chance To Hop Aboard The FTSE Bus?
The UK’s FTSE-100 Index is testing the level from which it broke out to all-time highs a month ago.
Our final Chart Of The Day, and accompanying post, for 2016 focused on the UK’s main stock index, the FTSE-100. Specifically, it noted that the index was breaking out to all-time highs. More specifically, the tone of the post was the new high’s juxtaposition against the consensus calls for financial calamity in the UK following the Brexit vote. The epic pundit forecasting whiff aside, the main point for investors was quite simply the significance of the FTSE’s new high, above the peaks of April 2015 and October 2016.
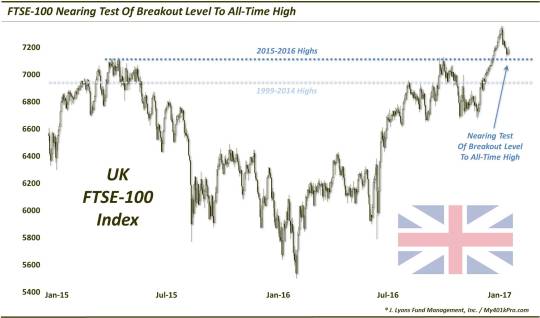
Furthermore, as a reminder, the new high near the 7100 level also marked a decisive break above the peaks from 1999-2000 and 2007.
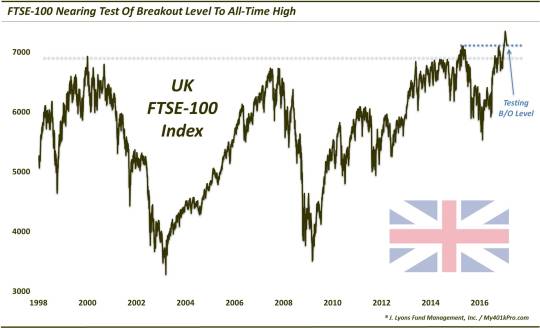
Thus, the significance of this breakout cannot be overstated. There is no guarantee that the breakout will be successful, of course. But after waiting 17 years, 2 cyclical tops and a serious intermediate-term top, the breakout of a month ago is a chart watcher’s dream. And the good news is, if you missed the breakout the first time, you’re getting another shot at it now. That’s because after about a 3.5% pop following the breakout, the FTSE-100 has now pulled back and is approaching a test of that breakout level.
Again, there is no guarantee in this business. All one can do is try to garner the best odds of success in a trade. In this case, testing 17 years of former resistance turned possible support represents about as high odds as one can hope to find. So needless to say there is compelling evidence to hop aboard the FTSE bus here.
________
More from Dana Lyons, JLFMI and My401kPro.
The commentary included in this blog is provided for informational purposes only. It does not constitute a recommendation to invest in any specific investment product or service. Proper due diligence should be performed before investing in any investment vehicle. There is a risk of loss involved in all investments.