Will This Chart Level Drive Auto Stocks Higher?

Auto stocks have been in a 2 and a half year slump; can this chart level finally ignite a rally?
As far as headlines go, today was about as newsy as it gets for automobile stocks. From General Motors to Ford to Tesla, there was no shortage of attention-grabbing events within the sector. Going forward, should auto stocks perform well from here, reporters and other market observers will certainly have an array of narratives to pick from in order to “explain” the rally. However, as we have frequently said, more often than not, chart levels provide the impetus for a market move. The narrative is attached later on in order to provide an unnecessary “why”. Let’s look at the present setup in auto stocks for a “for instance”.
Since jumping more than 600% in 2 years from the depths of the financial crisis, auto stocks have literally gone nowhere in 6 years. On January 3, 2011, the Dow Jones U.S. Automobile Index closed at 191.56. Today, January 3, 2017, the index closed at 194.63. And, actually, one could argue they’ve gone nowhere in 14 years since the DJ Auto Index closed at 194.87 back on January 3, 2003. Bottom line, the sector has had a rough ride over the last few decades.
There may potentially be a short-term ray of hope for these stocks, however. Zooming in a little closer on its chart, we see that the DJ Auto Index has been in a well-defined downtrend since an interim high back in September of 2014. The Down trendline connects the highs in February-March, June and October-December of 2015 and April and July of this year. Early last month, the index broke out above the trendline finally which, at the time, was intersecting near 191. After inching higher for a few weeks following that breakout, the DJ Auto Index has pulled back and is now back testing the broken post-2014 Down trendline.
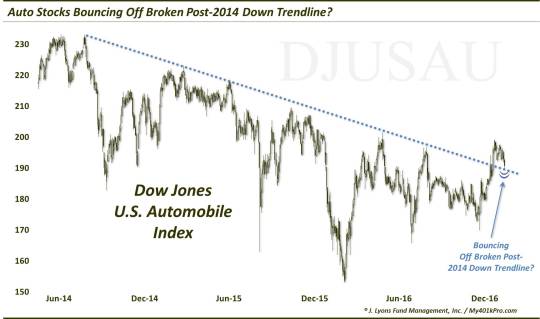
Aided by a healthy bounce in Ford’s stock especially, the DJ Auto Index bounced by 2% off of a precise touch of the trendline on Friday. Will the bounce continue? It remains to be seen. But when we are monitoring potential support or resistance points on a chart, we like it when prices give us a “tell”. In this case, the tell was an affirmation of the relevance of the broken post-2014 Down trendline. Thus, bounce or fail, we can be somewhat confident in relying on the trendline as the arbiter of the eventual direction in prices.
Either way, we’ll leave it up to the story-tellers to conjure up an “explanation” for the move.
________
More from Dana Lyons, JLFMI and My401kPro.
The commentary included in this blog is provided for informational purposes only. It does not constitute a recommendation to invest in any specific investment product or service. Proper due diligence should be performed before investing in any investment vehicle. There is a risk of loss involved in all investments.