
Bond Yield “Regime Line” Being Tested
The 10-Year U.S. Treasury Yield is testing the “ultra low-rate” bounds again.
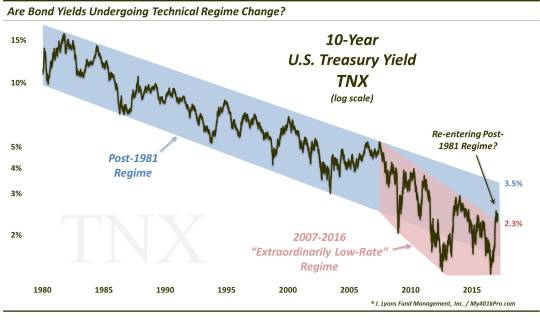
A month ago, we noted the significance of the post-election spike in bond yields. Of course, yields have been in a secular decline since topping out in the early 1980′s. However, since 2007, just prior to the financial crisis, yields experienced an acceleration to the downside. This acceleration marked what we considered a new regime for bond yields: an “ultra low-rate” regime. For nearly 10 years, this ultra-low rate regime in the 10-Year U.S. Treasury Yield (TNX) was contained by a Down trendline stemming from the 2007 peak in yields. The post-election move sent the TNX breaking above that trendline. Thus, while yields still remained well within the 30-plus year secular downtrend, the breakout, we surmised, signified the end of the ultra low-rate regime.
Of course, this is all subject to change if yields decide to cross the threshold back into the ultra low-rate zone. That threshold in the TNX, in our view, would appear to be the broken post-2007 Down trendline. Presently, that trend line is in the vicinity of the 2.31% level. Also in that vicinity are two key Fibonacci Retracement levels:
- The 23.6% Fibonacci Retracement of the July-December rally
- The 38.2% Fibonacci Retracement of the post-election rally
The TNX is presently testing this level, closing on February 24 at 2.31%.
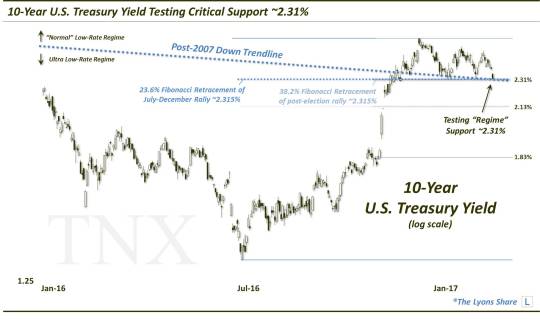
Whether or not this line is truly a regime-defining line is obviously up for debate (the 30-Year Yield, FYI, has not broken above a comparable post-2011 Down trendline, so that complicates the story). However, in practice, the long-term narrative may be irrelevant anyway. As long as the lines/levels are respected in the immediate term, that’s all we care about. And the TNX does, in fact, seem to be respecting the 2.31% level.
Twice, in January and early February, the TNX bounced off the level, suggesting it is indeed a line of importance so we will continue to consider it so. Should the level continue to hold, the TNX would seem destined to eventually test the secular downtrend in rates. Presently, there are a couple trendlines to take note of in that respect. A steep Down trendline stemming from the 1981 TNX peak currently stands around the 3.50% level. A shallower trendline beginning at the 1987 high presently lies in the vicinity of 3.80%. It may be worthwhile taking note of these levels should we see yields begin to rally again.
On the other hand, should this 2.31% level fail to hold, it will likely open up immediate downside to the 2.13% level. It would also put the TNX back within the confines of the post-2007 Down trendline and potentially much lower yields again.
These disparate paths have yet to be determined and the direction may well depend on the outcome of this battle at the 2.31% level.
_____________
Like our charts and research? Get an all-access pass to our complete macro market analysis at our new site, The Lyons Share (plus, sign up by February 28 to take advantage of our special launch deal).
Disclaimer: JLFMI’s actual investment decisions are based on our proprietary models. The conclusions based on the study in this letter may or may not be consistent with JLFMI’s actual investment posture at any given time. Additionally, the commentary provided here is for informational purposes only and should not be taken as a recommendation to invest in any specific securities or according to any specific methodologies. Proper due diligence should be performed before investing in any investment vehicle. There is a risk of loss involved in all investments.