
Don’t Bank On This Breakout?
The recent breakout in financials is occurring right into potential chart resistance.
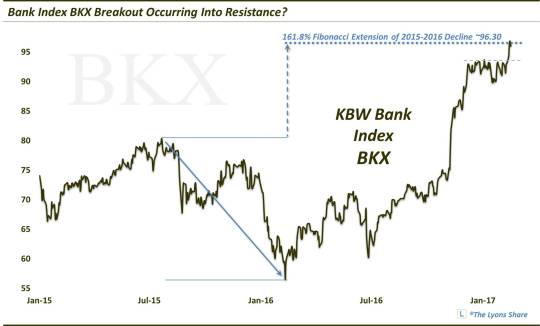
One of the big winners in the “Trump Rally” has been financials. In concert with the spike in bond yields, bank stocks jumped some 30% in the month following the election, as measured by the KBW Bank Index (BKX). After consolidating over the subsequent two months, the BKX finally broke out to new highs this week.
In doing so, it cemented the continued relative strength in the space.
But while the development has the look of a continuation pattern, i.e., to the upside, there is at least one piece of technical evidence dampening our enthusiasm regarding the breakout.
We have spent much of this week, including in a post on Monday as well as in our daily videos on The Lyons Share, discussing the concept of chart extensions, specifically Fibonacci Extensions. Here is what we had to say about the topic in Monday’s post regarding the Nasdaq 100:
“Fibonacci Extensions relate to the incremental moves that prices exhibit following a break out of a range. In this case we are looking at the NDX’s ranges corresponding to its declines from July-August 2015 and from November 2015-February 2016. Once the NDX finally broke above those ranges last summer, we could start measuring its “extension”. We measure it as a percentage of the range and monitor certain percentages that correspond to the Fibonacci sequence.
The most significant percentage in Fibonacci is 61.8%, or 0.618. That is the figure resulting from dividing one Fibonacci number by the next one in the sequence. In Fibonacci Extensions, we look for a 61.8% move above the previous range as a potential key marker. This level, expressed as a 161.8% extension of the range, is presently being reached on the chart of the NASDAQ 100 near 5260-5270.”
We bring this topic back up today because, while the breakout in the BKX looks inviting, it has sent prices directly into its own 161.8% extension of its 2015 to 2016 decline.
This Fibonacci Extension charting technique certainly is not infallible – nothing is. Furthermore, the stock market rally has displayed an obstinate momentum of late. However, these Extensions have proven reliable enough, in our experience, to warrant our respect. In this case, that respect dictates a healthy skepticism of the sustainability of the breakout.
Time will tell but, in our view, the immediate success of the breakout is certainly no money in the bank.
_____________
Like our charts and analysis? Get an all-access pass to our complete macro market analysis at our new site, The Lyons Share (plus, sign up by February 28 to take advantage of our special launch deal).
Disclaimer: JLFMI’s actual investment decisions are based on our proprietary models. The conclusions based on the study in this letter may or may not be consistent with JLFMI’s actual investment posture at any given time. Additionally, the commentary provided here is for informational purposes only and should not be taken as a recommendation to invest in any specific securities or according to any specific methodologies. Proper due diligence should be performed before investing in any investment vehicle. There is a risk of loss involved in all investments.


