
3 Key Risk On/Off Barometers Turning Down? (PREMIUM-UNLOCKED)
The following post originally appeared as a premium article on The Lyons Share on March 7, 2017.
A trio of metrics that normally fare well in good markets are faltering; but how serious is it?
We’ve been talking about a few sneaky barometers of “risk on/risk off” markets for a few weeks now. To clarify, stocks typically rally, and on firm footing, when these metrics are favorable as they indicate the willingness of investors to take on risk. And when they are fading, stocks tend to suffer, or are at least more vulnerable to weakness, as investors shy away from risk-taking. We have been discussing some of these risk on/off barometers lately (mainly in our daily strategy videos) because they have been threatening to switch to the “off” position. Action in the past few days has cemented that notion. Let’s take a look at the 3.
Small-Cap Pure Value Stocks
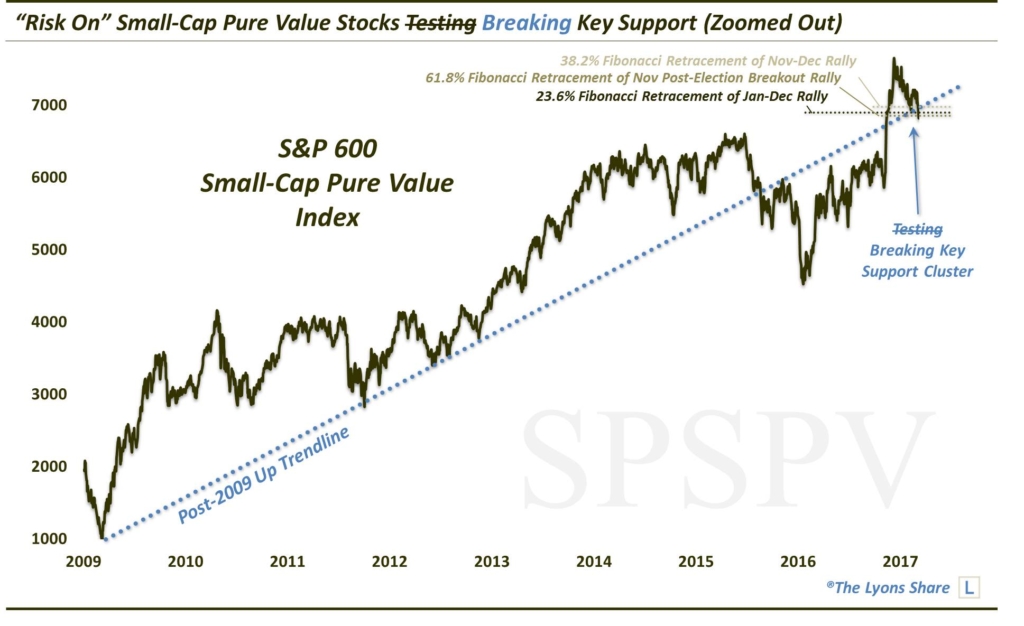
The first is the S&P Small-Cap Pure Value Index (SPSPV). As we have discussed, this index typically has the highest beta of any of the market cap style categories. Therefore, during favorable markets, such as the initial post-election rally, the SPSPV will generally lead as it did in November — to the tune of about 30% in a month. Since topping in December, however, the index has been pulling back, indicating perhaps a less-sustainable rally in stocks over the past few months.
As we mentioned in a post on February 1, the SPSPV had pulled back enough that it was testing what we viewed as a significant confluence of support, including:
- The post-2009 bull market Up trendline that served as support until mid-2015 – and perhaps again after reclaiming it in the immediate aftermath of the election.
- The 23.6% Fibonacci Retracement of the January-December 2016 rally
- The 38.2% Fibonacci Retracement of the November-December 2016 post-election rally
- The 61.8% Fibonacci Retracement of the rally from the post-election breakout
A bounce off that area would perhaps spur a new sustainable up-leg in the post-election rally; while a break of the level may signal a broader risk-off signal for the overall market. Well, it did bounce precisely off of that support but has struggled to make any upside progress over the past month. Thus, as the market softened in the past 4 days, the SPSPV found itself right back down at the key support level in short order.
In the past 2 days, the index has broken that support.
Here is a closer look.
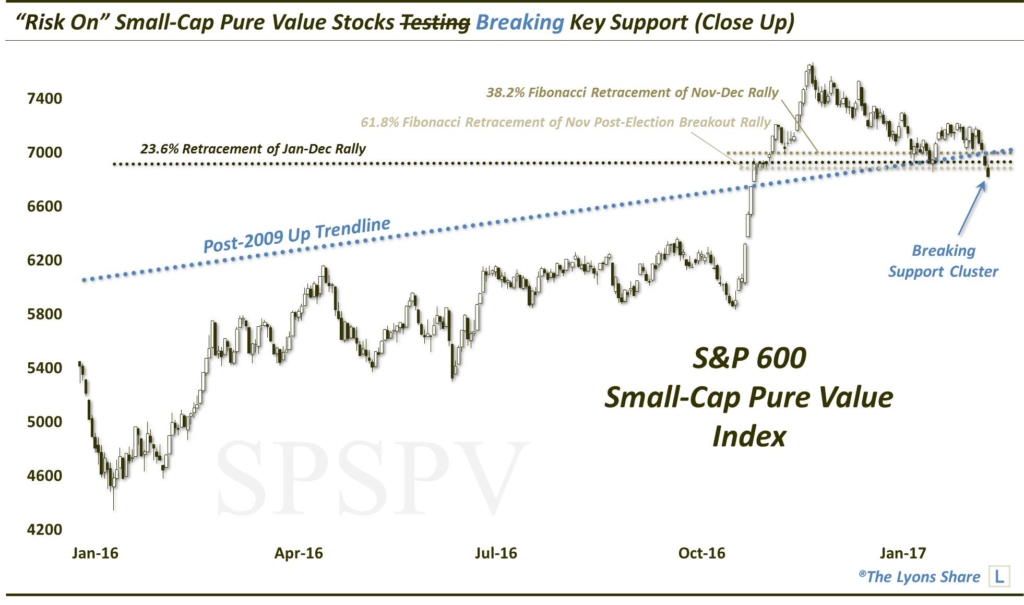
The fact that these small-cap value stocks were unable to bounce with the major averages over the past few months was a red flag. That they are now breaking considerable support is a bigger red flag. We have to think that if the index is unable to quickly reclaim the broken support, near 6900, that the broader market is susceptible to a selloff.
High Yield Bonds
The 2nd risk-on/off barometer we are watching is the high yield bond space. As high yield represents the riskiest of all bonds, the space actually trades in concert with equities much of the time. Thus, when high yield bonds are rallying, it is indicative of risk-taking, which generally includes a rallying stock market. This has been the case since high yield bonds bottomed out just over a year ago. Since that time, the rally in high yield bonds has been extremely persistent, with just a brief blip leading up to the election. Using the iShares High Yield Bond ETF (ticker, HYG) as a gauge, the space is up nearly 20% in the past year, and that’s without adjusting for the fund’s 5% yield.
Speaking of unadjusted, as we have been noting in recent weeks, however, the HYG has been approaching an important potential line of resistance. Specifically, on the unadjusted chart of the HYG, the fund has now rallied up to the 61.8% Fibonacci Retracement of the decline from its 2013 major cycle high to its 2016 low. That line sits at around the 88.2 level.
A week ago, the fund attempted to move above the level, closing at 88.36 on February 27. We hinted that, given the magnitude of the Fibonacci level, there was probably a better than average chance that the “breakout” would fail. That was especially true given the lack of consolidation prior to the attempted breakout. Indeed, over the past few sessions, the HYG has pulled back fairly sharply, closing today at 87.14.
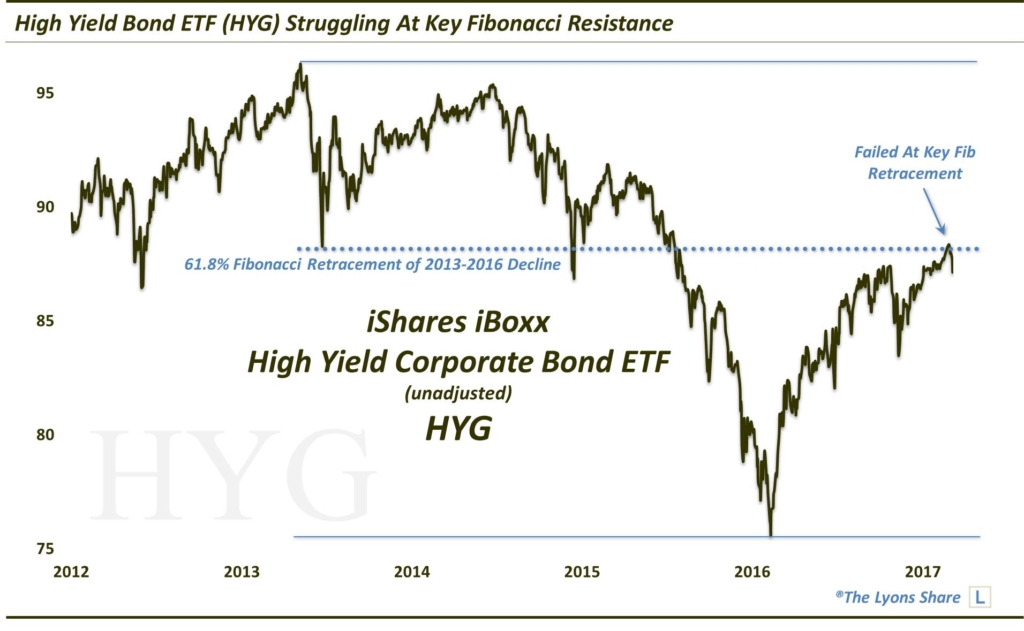
Certainly, being just a few days off of a multi-year high, this action doesn’t signify a major breakdown in the high yield bond space. However, if the level here is as formidable as we’ve suggested, high yield bonds may have a very difficult time re-engaging a sustainable risk-on move in the near-term.
High-Beta Stocks
Lastly, let’s look at high-beta versus low-volatility stocks. As you might guess, it has typically been the high-beta stocks that have out-performed on a relative basis when the stock market has been in a risk-on mode. This can be seen in a performance ratio between the PowerShares S&P High-Beta ETF (ticker, SPHB) and the PowerShares S&P Low-Volatility ETF (ticker, SPLV).
When the High-Beta/Low-Volatility Ratio is rising, stocks tend to do well, in general. That was the case from 2012 to the spring of 2015, and again from early 2016 throughout most of the year. When the ratio has sloped downward, as it did from early 2015 to early 2016, stocks have been subjected to bouts of risk-off behavior by investors. In the past few days, the ratio has arguably broken its Up trendline spanning the past 9 months.
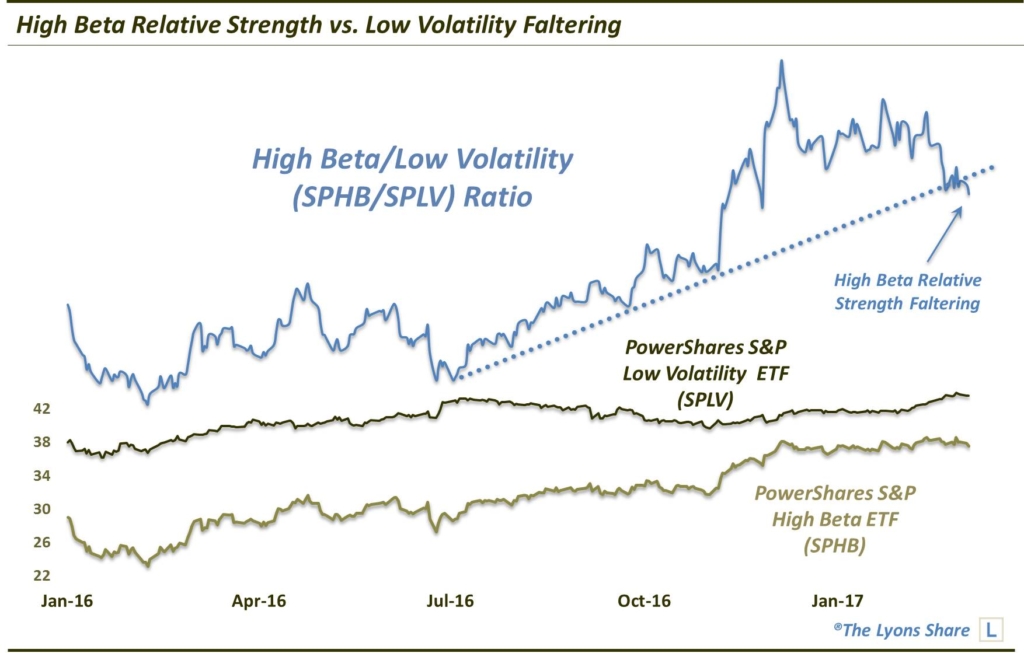
Now, given the fact that the SPHB has not suffered too much on an absolute basis, we’re not going to go overboard in ringing the alarm bells. Much of the recent change in fortunes in the ratio can be attributed to the post-election resurgence in low-volatility stocks. However, the inability of the high-beta space to keep up is at least a signal that the level of risk-taking in the market has likely been downgraded of late — as compared to that of the past 12 months, or in the immediate aftermath of the election.
So those are 3 metrics that we look at which can serve as non-traditional barometers of the status of the risk-on versus risk-off dynamic in the stock market. They are not infallible (nothing is). However, we like to track them, and other such under-the-radar indicators, as they can provide a valuable “tell” pertaining to the market’s risk posture — without being subject to the gaming and exploitation that more mainstream indicators are susceptible to given their hyper-popularity. And while these 3 indicators are nowhere near the red-alert, sky is falling level of concern, recent developments surrounding them certainly warrant a measure of caution here. It is especially true considering the key extension levels being tested by a host of popular averages that we have been noting for some time — as well as the prevailing, overly-bullish investor sentiment.
Given the market’s somewhat tenuous state in the near-term, should these risk-off signals prove accurate, stocks could be susceptible to a sharp selloff, even if temporary.
_____________
Like our charts and research? Get an All-Access pass to our complete macro market analysis, every day, at our new site, The Lyons Share .
Disclaimer: JLFMI’s actual investment decisions are based on our proprietary models. The conclusions based on the study in this letter may or may not be consistent with JLFMI’s actual investment posture at any given time. Additionally, the commentary provided here is for informational purposes only and should not be taken as a recommendation to invest in any specific securities or according to any specific methodologies. Proper due diligence should be performed before investing in any investment vehicle. There is a risk of loss involved in all investments.


8 Comments