
Long Bond Threatening Regime Change Of Its Own (PREMIUM-UNLOCKED)
The 30-Year Yield is threatening to break out of its “ultra low-rate” environment.
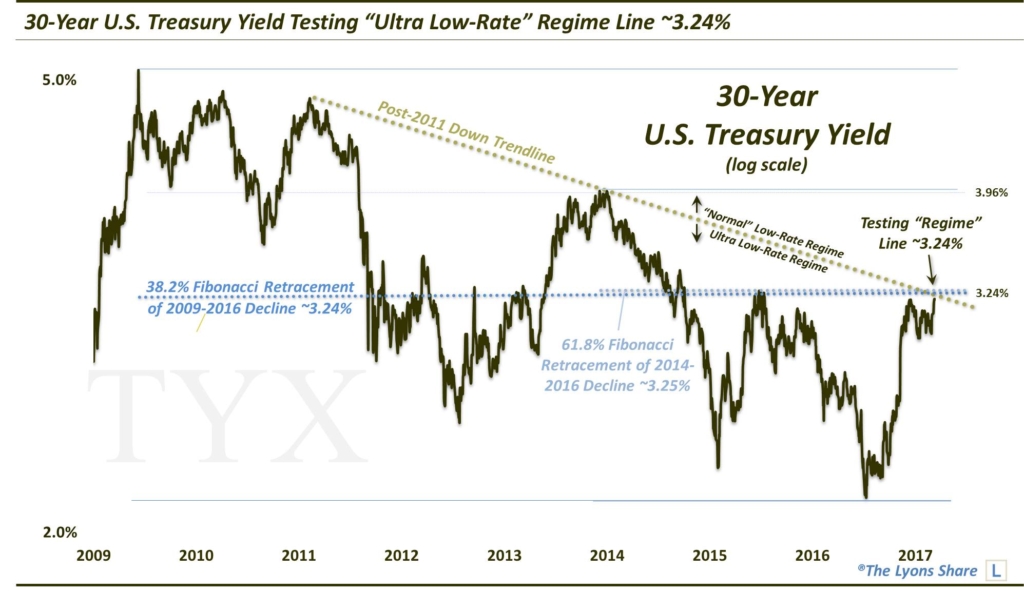
A couple months ago, we noted an “ultra” important development in the 10-Year U.S. Treasury yield. Interest rates, of course, have been in a secular downtrend for the last 3 1/2 decades. Since the financial crisis, however, rates have been especially depressed in what we have referred to as the “ultra low-rate” yield regime. In the aftermath of the presidential election, the 10-Year Yield (TNX) broke above the post-2007 Down trendline that we considered the defining line of the ultra low-rate regime. The TNX has since tested the top side of that broken trendline numerous times and each time it served as support, resulting in a bump in yields. Now, as Monday’s Chart Of The Day reveals, the 30 year U.S. treasury yield is testing a regime line of its own near 3.20%-3.25%.
However, there is a catch.
The difference is that, while the 10-Year Yield has broken above its post-2007 Down trendline that, in our view, had contained the ultra low-rate regime, the 30-Year Yield (TYX) has not. Rather, the TYX is just now testing the post-2011 “regime line”, currently near 3.20%-3.25%. Also in the same vicinity are 3 important Fibonacci Retracement lines:
- The 23.6% Fibonacci Retracement of the 2000-2016 Decline (not shown)
- The 38.2% Fibonacci Retracement of the 2009-2016 Decline
- The 61.8% Fibonacci Retracement of the 2014-2016 Decline
Given the formidable confluence of resistance, it should be difficult for the TYX to break out above the 3.25% level. However, as the TNX demonstrated, it is not impossible. In fact, it is inevitable — it’s just a matter of when. Should the TYX break above here, the next resistance may come near 3.55%, with monumental resistance just south of 4%.
So how do we reconcile the TNX breaking out of its ultra low-rate regime while the TYX remains within its confines? We don’t try to reconcile it. For whatever reason, it is what it is — markets will do such imponderable things on a regular basis. The point is how to take advantage of the circumstances.
Do we think that the TNX and TYX will go in different directions? Not in any material way, no. However, it gives one nice options to play the bond market, long or short. Specifically, if one wants to go long the bond market, the 30-Year may be a better option considering the lack of “regime” change thus far. The 3.25% area is a natural and close-by potential stop-loss point for the bulls, should yields close above there.
On the other hand, bond bears may wish to choose the 10-Year when shorting considering the TNX has already broken above — and successfully tested — its own regime line. Thus, the TNX may have a more difficult time moving lower considering the staunch support near the 2.31% level. Of course, it is currently bumping into yield resistance of its own near 2.62%, so a short entry isn’t necessarily ideal here (not to mention the record speculator shorts in 10-Year futures).
The point is that bond bulls (30-Year) and bears (10-Year) each have a vehicle that may be better suited for their posture, whenever their entry point may arise.
_____________
Like our charts and research? Get an All-Access pass to our complete macro market analysis, every day, at our new site, The Lyons Share .
Disclaimer: JLFMI’s actual investment decisions are based on our proprietary models. The conclusions based on the study in this letter may or may not be consistent with JLFMI’s actual investment posture at any given time. Additionally, the commentary provided here is for informational purposes only and should not be taken as a recommendation to invest in any specific securities or according to any specific methodologies. Proper due diligence should be performed before investing in any investment vehicle. There is a risk of loss involved in all investments.