Russian Stocks Testing Key Support
Recent selling pressure has brought the Russian MICEX Index down to a confluence of chart support just above its prior all time highs.
Back in August, we noted the breakout to all time highs in the Russian MICEX Stock Index. While aided by the depreciation in the Ruble in recent years, the new high was impressive nonetheless for the beleaguered emerging market. The index was able to move modestly higher in the weeks following the breakout. However, it soon began to settle back down. By early November, the MICEX had returned to test its breakout area.
Aided, evidently, by a certain event in the U.S. around that time, the test was a rousing success. By New Year, the index had bounced nearly 20%. Since that first day of the year, however, the Russian “Bear” has indeed been quite bearish. In fact, it has lost nearly its entire post-election gain. The MICEX now finds itself testing a confluence of potentially key support levels on its chart, just above its August breakout point.
You have probably seen us write about Fibonacci levels in the past and, indeed, that analysis plays a central role in the potential support we’re seeing now in the MICEX. We like to identify situations where multiple Fibonacci levels align in the same vicinity. This gives us more confidence in the relevance of the level. The MICEX presents a good example of that here near the 2030 level as we see a confluence of three key Fibonacci Retracement lines stemming from the important lows since the 8-year low in 2014:
- The 23.6% Fibonacci Retracement of the 2014-2016 rally
- The 38.2% Fibonacci Retracement of the January 2016-January 2017 rally
- The 61.8% Fibonacci Retracement of the July 2016-January 2017 rally
Toss in the 200-Day Simple Moving Average at 2031 to boot, and you have a pretty formidable confluence of support there. The MICEX closed today at 2035.77.
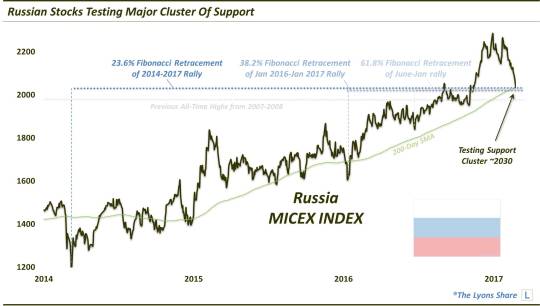
In most circumstances, we would be inclined to place a high level of confidence in the potential support likely to be exhibited by this confluence. However, we can’t help but notice that the previous all-time highs are just about 3% below here, near the 1970 level. Thus, we wonder if the MICEX is destined for another test of that level.
On their own merits, though, the levels combining to form the potential support cluster in this area should be enough to turn this “Bear” bullish once again.
_____________

Like our charts and research? Get an all-access pass to our complete macro market analysis at our new site, The Lyons Share (plus, sign up by February 28 to take advantage of our special launch deal).
Disclaimer: JLFMI’s actual investment decisions are based on our proprietary models. The conclusions based on the study in this letter may or may not be consistent with JLFMI’s actual investment posture at any given time. Additionally, the commentary provided here is for informational purposes only and should not be taken as a recommendation to invest in any specific securities or according to any specific methodologies. Proper due diligence should be performed before investing in any investment vehicle. There is a risk of loss involved in all investments.