
Vexing VIX Behavior – Part 1 (PREMIUM-UNLOCKED)
The VIX is at a 5-month high — despite relatively limited damage in the S&P 500. What does that mean for expectations in the stock, and volatility, markets?
Most folks who are active participants in the markets have certain securities or tickers that are thorns in their sides. Either they tend to lose money trading them, or else they simply struggle to understand their behavior. For us, one such market nemesis is the S&P 500 Volatility Index, a.k.a., the VIX. It’s not necessarily that we don’t understand the instrument. The VIX is an options-based indicator that measures 30-day volatility expectations for the S&P 500. Our challenges have more to do with the fact that we haven’t figured out how to use it to any advantage, monetarily. This vexation with the VIX makes its current behavior that much more perplexing.
In general, the VIX is rather straightforward in its movement. Because of the way that call options are treated relative to put options, the VIX typically moves in the opposite direction of the S&P 500, i.e., when stocks move up, the VIX moves down, and vice versa. Because of that tendency, the VIX has become known as the “fear gauge”. Recent behavior of the VIX, however, has deviated from its normal pattern.
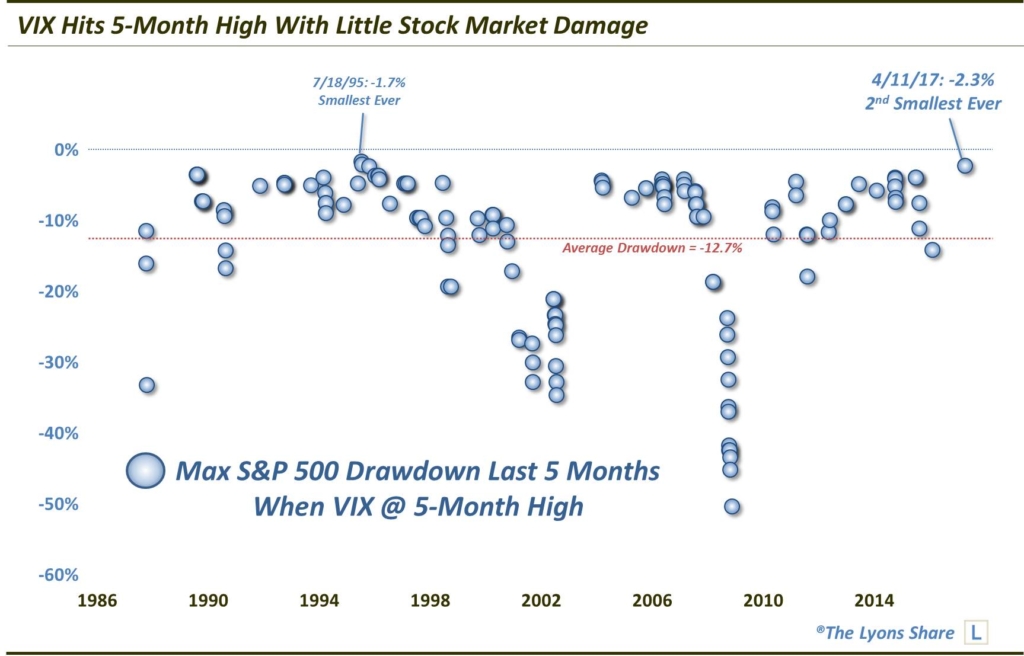
Specifically, on April 11, the VIX closed at a 5-month high. Such a milestone would normally imply a rough patch of not insignificant weakness in the stock market. At least, that would be the assumption based on historical evidence. Since the inception of the VIX in 1986, it has closed at a 5-month high on 147 days. Of those 147 days, the S&P 500 had experienced an average drawdown over the prior five months of -12.7% — and a median drawdown of -8.5%. The S&P 500’s max drawdown over the past five months is a mere -2.27%. That is the smallest drawdown of all such days, outside of -1.7% on July 18, 1995.
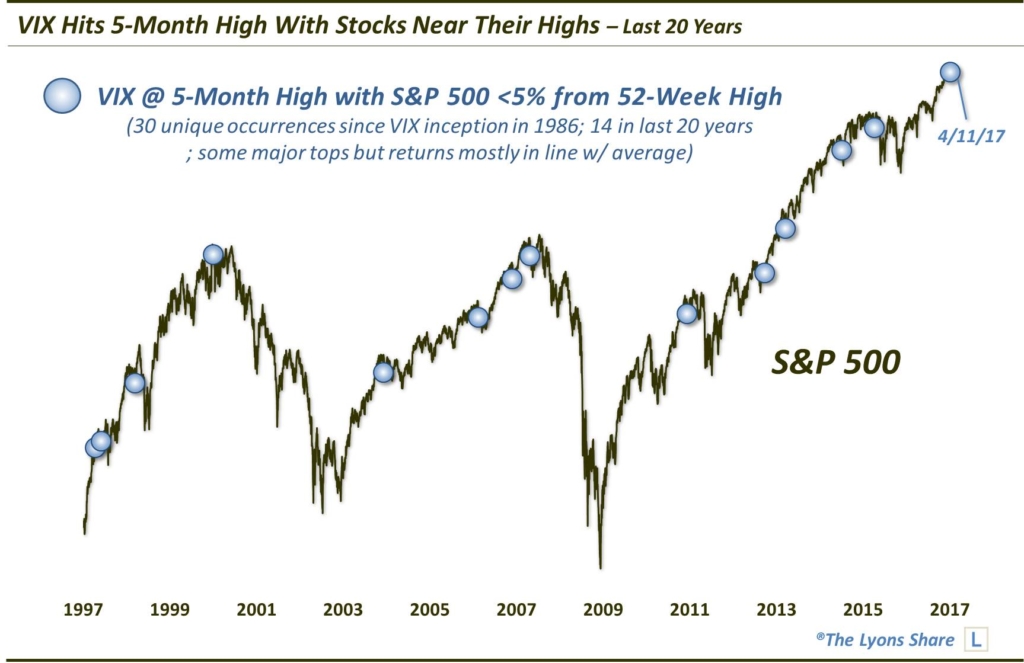
Looking at this recent development from another angle, the average distance of the S&P 500 from its 52-week high on the 147 days when the VIX closed at a 5-month high is 11.7%. On April 11, the S&P 500 closed exactly 1.76% from its 52-week high. That is the 8th closest of any of the 147 VIX 5-month highs since 1986 – and the closest in the past 20 years. It is also just the 30th unique occurrence within 5% of the S&P 500’s 52 week high – and the 14th in the past 20 years.
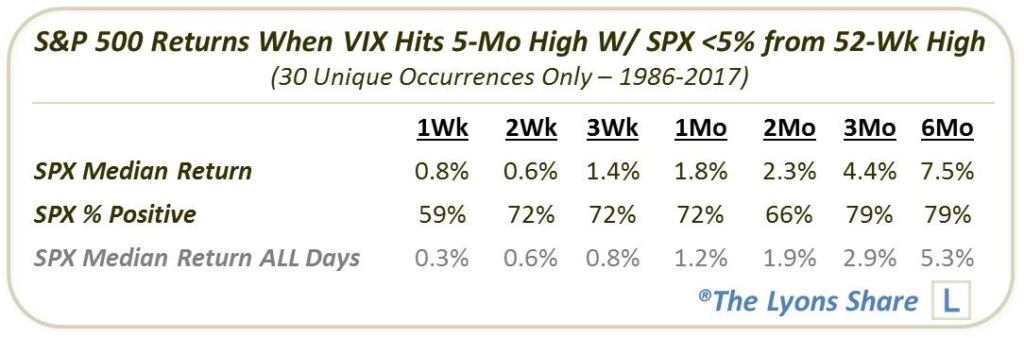
So what does this mean? Again, our attempts to understand the behavior of the VIX in a way that gives us a market edge continues to be elusive. Like a number of studies that we’ve done recently, several of the historical occurrences have come in close proximity to significant cyclical or intermediate-term tops in the market (see above chart). However, in aggregate, S&P 500 returns following these events are generally in line with, or better than, returns following all days.
That said, perhaps the best tendencies can be found in the behavior of the VIX itself following such occurrences. As the following table points out, prior occurrences have consistently led to drops in the VIX over the short to intermediate-term. Perhaps we have finally found a VIX related edge!
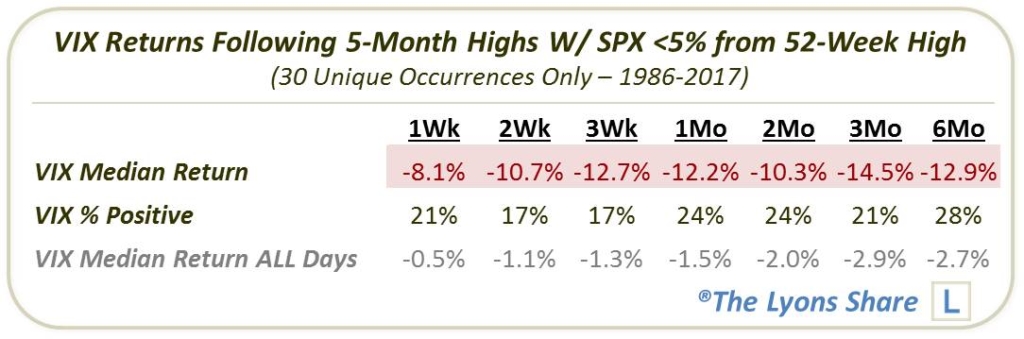
When navigating the markets, it often pays to be aware of what not to focus one’s attention on. For us, the VIX is one such instrument that we have learned to avoid when attempting to trade the stock market. In this case, we may have finally found a way to gain an edge using the VIX – only, in the VIX market itself rather than in stocks. If historical tendencies prove to be reliable, expect a drop-off in volatility over the next several weeks two months.
Stay tuned for Part 2 of the Vexing VIX where we take a peek at the unusual behavior in the VIX term structure.
_____________
Disclaimer: JLFMI’s actual investment decisions are based on our proprietary models. The conclusions based on the study in this letter may or may not be consistent with JLFMI’s actual investment posture at any given time. Additionally, the commentary provided here is for informational purposes only and should not be taken as a recommendation to invest in any specific securities or according to any specific methodologies. Proper due diligence should be performed before investing in any investment vehicle. There is a risk of loss involved in all investments.

