
Stock Traders Overreact (Again) To Wednesday’s Selloff
Volatility expectations took record jumps during Wednesday’s “big” selloff.
Wednesday saw the stock market break out of its historically tight trading range – and it did so in dramatic fashion. After, for example, trading in a 16-day low-high range of barely 1%, the S&P 500 nearly doubled that range on Wednesday alone en route to a 1.8% loss on the day. That marked the biggest daily loss for the index in over 8 months. In a way, though, the recent tight, range-bound action likely made the loss feel larger than it really was. No, were not sneezing at a 1.8% loss. But to put it into perspective, the 1.8% loss was just the 53rd worst in the last 6 years.
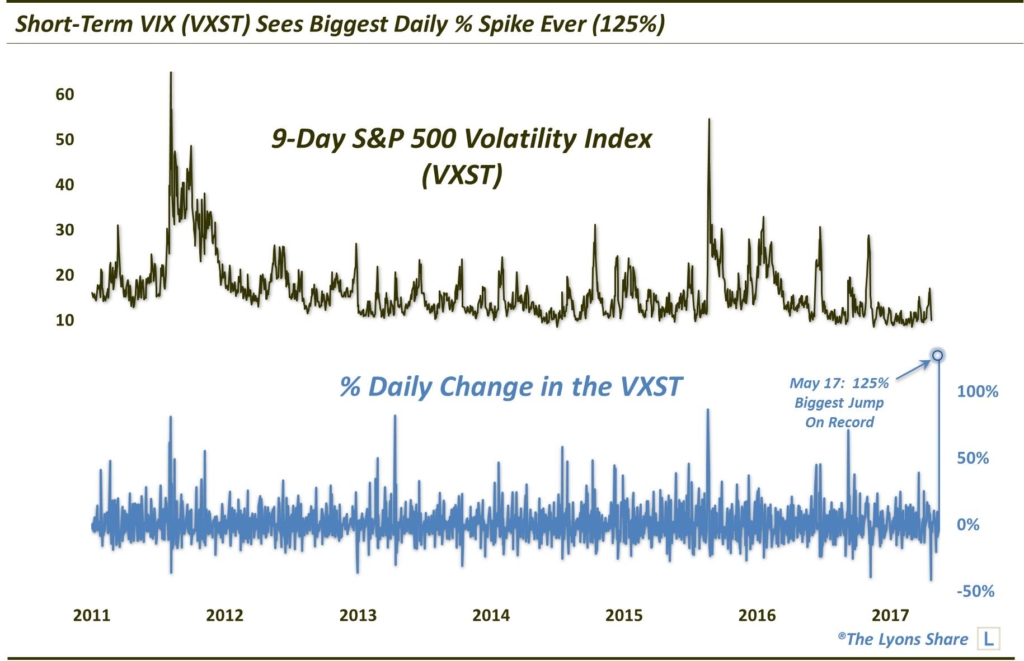
We mention 6 years because that is how long the 9-Day S&P 500 Volatility Index, or VXST, has been around. And as much as anyone, traders in this vehicle seemed to have been especially spooked by Wednesday’s stock market drop. That’s because Wednesday saw the single largest daily spike in the history of the VXST. But even that is understating things. The VXST actually more than doubled on Wednesday, rising 125% from 8.96 to 20.17. The spike was nearly 50% larger than even the previous record (8/21/2015).
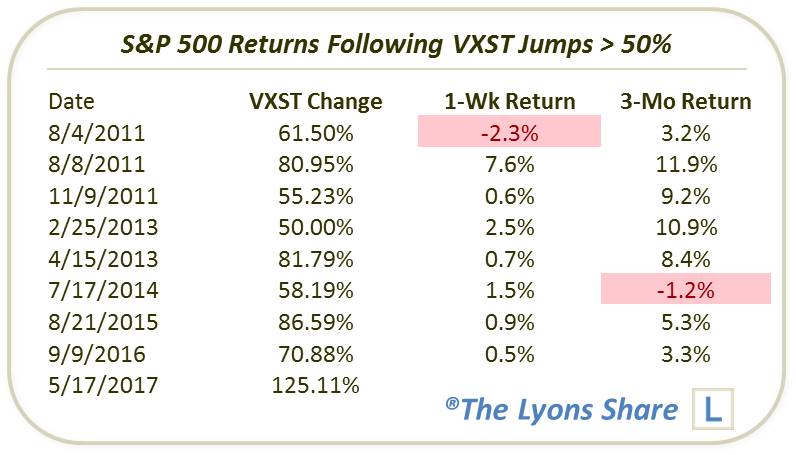
Looking at the VXST’s brief history, we see that the S&P 500 has almost unanimously rebounded strongly in both the short and intermediate-term:
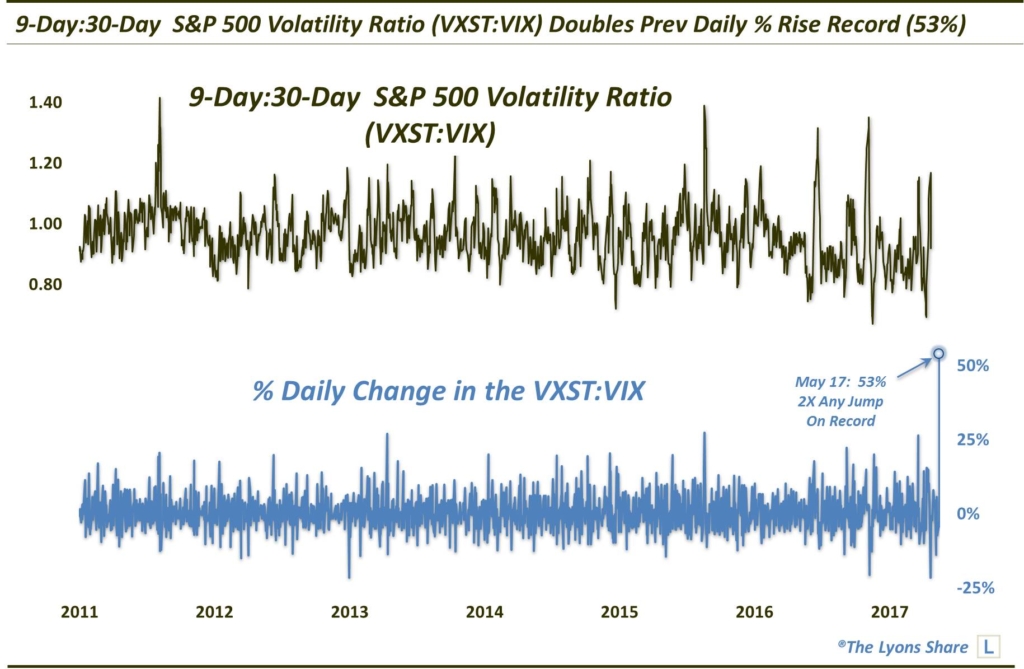
It wasn’t just the jump in the absolute level of the VXST that was noteworthy, though. As we have mentioned in several posts in the past, an effective method of measuring trader sentiment in recent years has been via the volatility term structure. That is, measuring the various durations of the S&P 500 Volatility Indices vs each other. When the near-term indices rise substantially relative to those further out, it can be a sign of trader fear. And when the levels hit extremes, or rise substantially in a day, it can be one indication that fear is rampant enough to allow for a stock market bottom, of some magnitude. This was arguably the case after Wednesday’s action – certainly, based on the latter.
We say that because Wednesday saw the ratio of the 9-Day S&P 500 Volatility Index (VXST) vs. the 1-Month Index (VIX) record an epic jump. The rise in the VXST:VIX Ratio of 54% exactly doubled the previous record jump (also 8/21/2015).
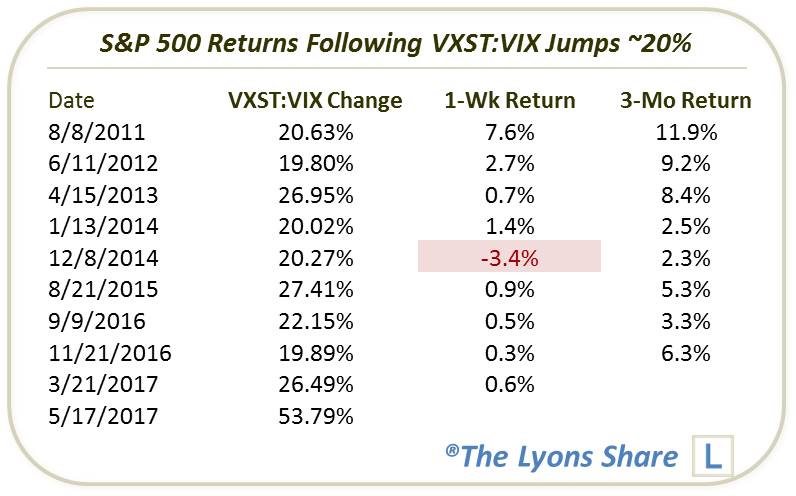
Like the straight VXST spikes, big jumps in the VXST:VIX have been a pretty good marker of extreme fear. And stocks, again, have almost unanimously bounced in the short to intermediate-term going forward:
As the week comes to a close, we see the VXST and VXST:VIX Ratio rapidly retreating from their respective record Wednesday spikes. Accordingly, we see stocks bouncing back firmly, as the above precedents suggested would be the case. Thus, it appears as though, once again, volatility traders overreacted to Wednesday’s selloff.
For daily research and charts to help keep you objective – and avoid overreacting to market gyrations and news headlines – check out our new “all-access” service, The Lyons Share. TLS members get daily access to our complete macro market assessment, including key chart developments in stocks, bonds, commodities, currencies, etc. – as well as pertinent and original research like this post.
FYI, if you want to join us, please Sign Up Now! For just the next 2 days (expires May 21), we are offering a big discount to new members!

_____________
Disclaimer: JLFMI’s actual investment decisions are based on our proprietary models. The conclusions based on the study in this letter may or may not be consistent with JLFMI’s actual investment posture at any given time. Additionally, the commentary provided here is for informational purposes only and should not be taken as a recommendation to invest in any specific securities or according to any specific methodologies. Proper due diligence should be performed before investing in any investment vehicle. There is a risk of loss involved in all investments.

