The Black Sheep Among Global Equity Markets? (PREMIUM-UNLOCKED)
Amid a sea of positive developments among global equity markets, one country is a glaring exception.
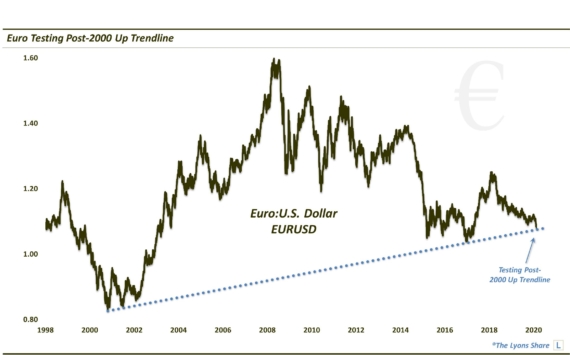
We like to say we don’t choose our Charts Of The Day or the subjects of our market blog posts – they choose themselves. In other words, we simply go to where the action or opportunity is in the markets at a given time and highlight it for our subscribers and followers. In 2017, much of that action has been in international equity markets as they have enjoyed a nice resurgence of late. The positive action isn’t contained to one market segment or region of the world either. We have highlighted positive developments in India, Europe, Russia, Emerging Asia and international equities in general, to name a few. There is one influential country, however, that we have not highlighted: China.
The reason being is that there are not many highlights coming out of China, from a technical perspective. And as a matter of fact, the Chinese Shanghai Composite (SSEC) just suffered a potentially egregious lowlight. Specifically, the SSEC just broke below the Up trendline stemming from its 2014 lows that has supported the index on at least a half a dozen occasions since January 2016.
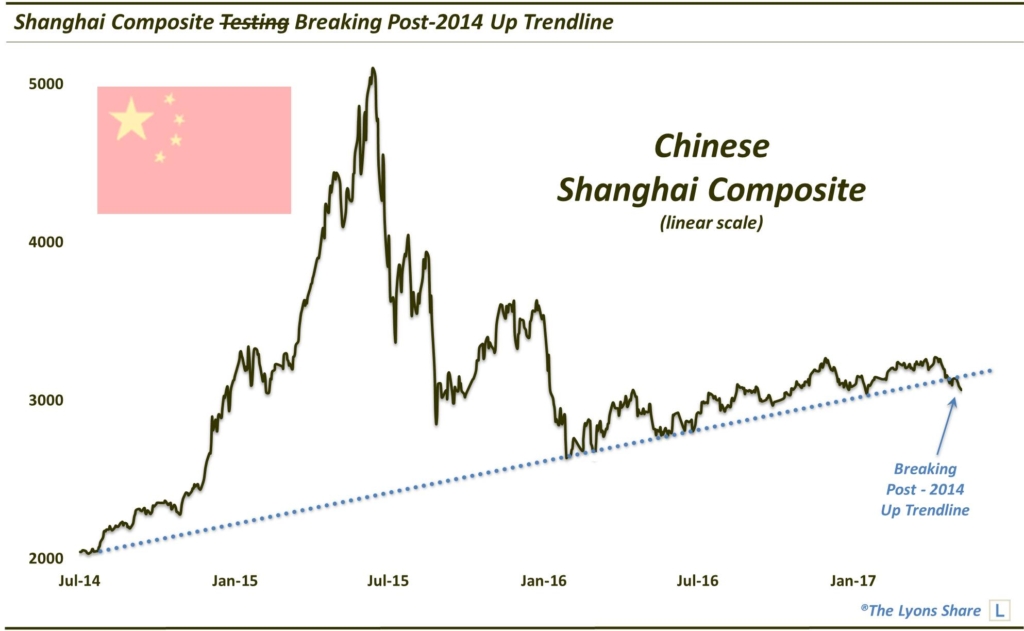
While folks may scoff at this trendline, or technical analysis in general, we don’t suggest taking this development for granted. We are taking the breakdown seriously if only due to the strict adherence, or respect, that the SSEC has paid this trendline upon its numerous touches over the past 16 months. But is this development a threat to derail the ongoing rally among the rest of the global equity market?
Right off the bat: this is a problem pertaining to the Chinese equity market; it should not be treated as a potential catalyst to take down global markets — at least not yet. First off, when global markets collapse, it will be because they are in a position wherein they are vulnerable to a collapse. That is not currently the case based on the market structure and foundation.
We have always seen substantial deterioration in market internals as well as price structure prior to a durable and substantial breakdown. When those conditions are in place, then we can start worrying about a serious decline. And when that decline comes, financial media and pundits will ascribe whatever narrative they want to “explain” the decline. However, you and I will know A) it’s a bunch of bull, and B) it’s irrelevant anyways. Gains are gains and losses are losses, no matter the “reason”.
That said, certainly from an economic standpoint, developments out of China can have a significant impact. But, as we have often repeated, economic study has, in our view, surprisingly little to do with making money in the markets. Perhaps one will have a better chance “playing” the resource and commodity market as a result of data out of China. But even then, I would much rather make decisions on the iron ore market or crude oil market based on iron ore and crude, then on Chinese equities.
So let’s keep it simple and just focus on the repercussions in the Shanghai Composite itself. What are the key levels to watch?
First off, we are under the assumption that the parabolic blowoff rally in 2014-2015 marked a bubble top of some kind. After losing 78.6% of that rally, the meager bounce off of the early 2016 lows has been wholly uninspiring. In fact, from a secondary high in December 2015, the SSEC proceeded to drop nearly 30% in barely a month into its January 2016 low. In the 16 months since, the index has managed to recover just 61.8% of that decline so, again, uninspiring.
If you are guessing that we are not too optimistic about the Shanghai Composite, you are correct. But it is all based on the chart action, nothing economic, demographic, political, etc., etc.. So where is the SSEC likely to go in the immediate-term? Let’s focus on potentially key Fibonacci levels (especially since the index has recently traversed along a path consistent with Fibonacci levels, as mentioned in the prior paragraph).
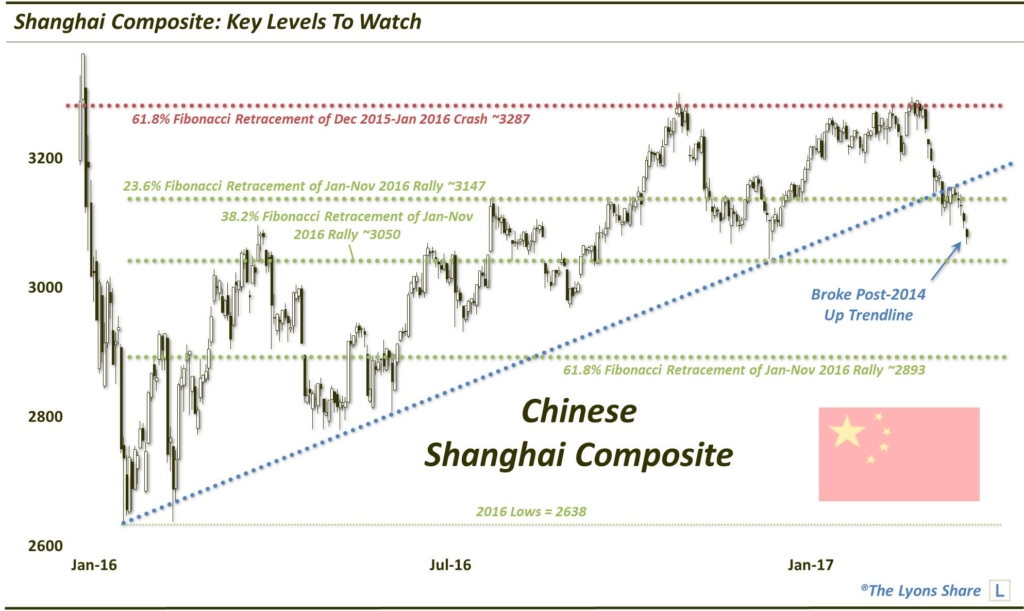
First, let’s assume the SSEC does not reclaim top side of the post-2016 Up trendline, which would open the upside up to recent highs near 3287 — then eventually 3600. Looking instead to the south, the breakdown of the post-2016 Up trendline on April 24 occurred at approximately the 3147 level, which just happens to be the same level as the 23.6% Fibonacci Retracement of the January-November 2016 rally (not to mention, the 200-day moving average).
The next support level below may be the 38.2% Fib Retracement near the 3050 level. This was also the approximate level as the January 16 intra-day spike low, which led to the rebound and April test of last November’s highs.
Below there is the 61.8% Fib Retracement of the 2016 bounce near 2893. It would also be the 161.8% Fibonacci Extension of the January-April bounce of this year. Additionally, it will soon be the location of the rising 200-week moving average on the SSEC. This confluence of levels doesn’t guarantee the index will test this level. But it does make it a compelling support level if it does.
Lastly, even if the SSEC does test this 61.8% level, eventually — and bounces — we would not be surprised to see such a bounce be merely temporary. The reason we suggest this is because of the cycle structure of the index. Specifically, the action since the 2015 bubble top suggests an ABC wave structure, with the 2015-2016 decline being the A-wave and the 2016 bounce as a weak B-wave.
If this is so, the C-wave that awaits should be another significantly damaging one. It does not necessarily need to equal the post-bubble top drop. However, we would expect that it stands a very good chance of undercutting the early 2016 low near the 2638 level. We are getting ahead of ourselves but potential, eventual, landing spots could be the 88.6% Fibonacci Retracement level of the 2014-2015, near 2390, or even the 2014 lows/launch point down near 2000.
Bear in mind, these levels are just guideposts should the Shanghai Composite continue down this path to the downside. Such a path would not surprise us in the least, however, as, in our view, another shoe is due to drop following the 2015 bubble implosion.
_____________
Disclaimer: JLFMI’s actual investment decisions are based on our proprietary models. The conclusions based on the study in this letter may or may not be consistent with JLFMI’s actual investment posture at any given time. Additionally, the commentary provided here is for informational purposes only and should not be taken as a recommendation to invest in any specific securities or according to any specific methodologies. Proper due diligence should be performed before investing in any investment vehicle. There is a risk of loss involved in all investments.