Support For Russia Crumbling? (PREMIUM-UNLOCKED)
**The following post was originally issued to TLS members on June 2, 2017.
The Russian stock market is threatening to break down below a critical chart level.
No, this post has nothing to do with politics, diplomacy or international relations. In fact, you will not see the words hack, tamper, treason – or covfefe, for that matter — in this post (at least after this sentence). Nor do you need to worry about any “fake news” here. We are only concerned about markets and truth. And in the markets, as they say, “price is truth”. And sometimes the truth hurts. That very well may be the case right now in Russian stocks.
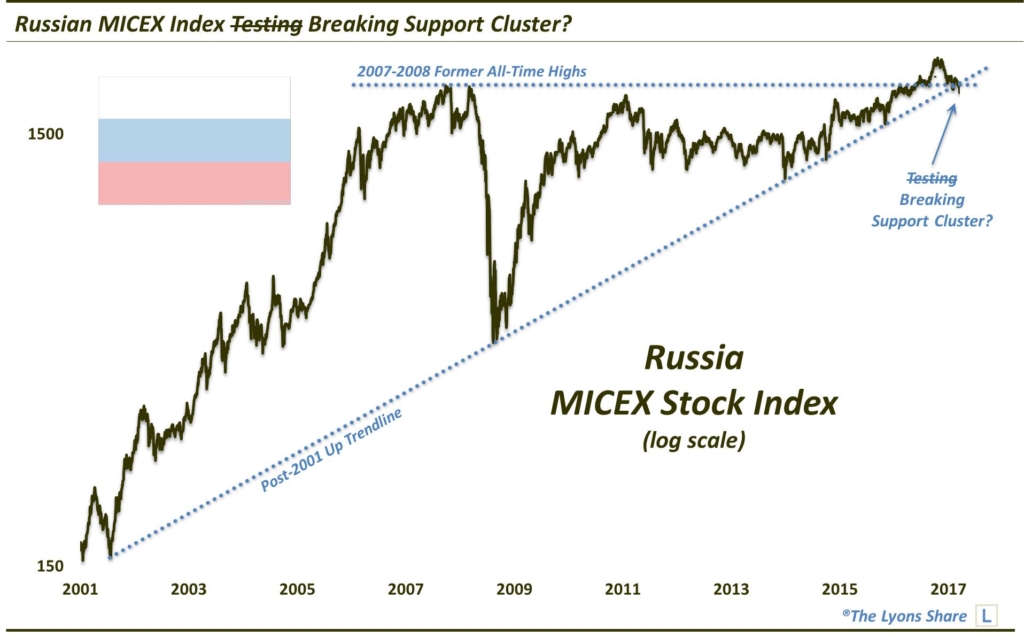
After topping out in 2011, the Russian stock market was a global laughingstock for several years as the country went through some economically calamitous times. These tough times saw Russia’s currency, the Ruble, get decimated. This depreciation in the ruble, however, served to support the prices of Russia’s main local stock index, the MICEX. After bottoming in early 2014, the index would double in price by the start of 2017.
During a rally following the U.S. presidential election last November, the MICEX achieved another milestone. It was able to finally register a new all-time high near the 1970 level, eclipsing the former highs set back in 2008. After tacking on another 15% into January of this year, the index began to pull back. And by early March, it had pulled all the way back to test the breakout level at the former all-time highs.
Around the same time, we found the MICEX testing another key line on its chart. Since its inception in 2001, the MICEX has been climbing an Up trendline (on a log scale), including touches in 2008, at the early 2014 low, in December 2014 and January 2016. By mid-April, the index had pulled back to test the trendline once again. After threatening to break down below the trendline, the MICEX would bounce into early May.
The MICEX was not able to sustain the rally, however, and it would quickly drop back to test the trendline one more time. And late last week, as the trendline was meeting up with the former highs at the 1970 level, the index would suffer a clear break down below the trendline.
So should this breakdown have investors Russian for the exits? The breakdown does appear to clinch the notion of a post-election “false breakout”. Such false breakouts can result in powerful and painful losses once they reverse and break support, as we are seeing now. However, there may be one more glimmer of hope — though, perhaps a long shot — on the MICEX chart.
In the vicinity of 1860-1870, right where the MICEX closed yesterday, there is a near-perfect cluster of Fibonacci Retracement levels from the key lows going back to 2008, including:
- the 23.6% Fibonacci Retracement of the 2008-2017 rally ~1870
- the 38.2% Fibonacci Retracement of the 2014-2017 rally ~1870
- the 61.8% Fibonacci Retracement of the 2016-2017 rally ~1860
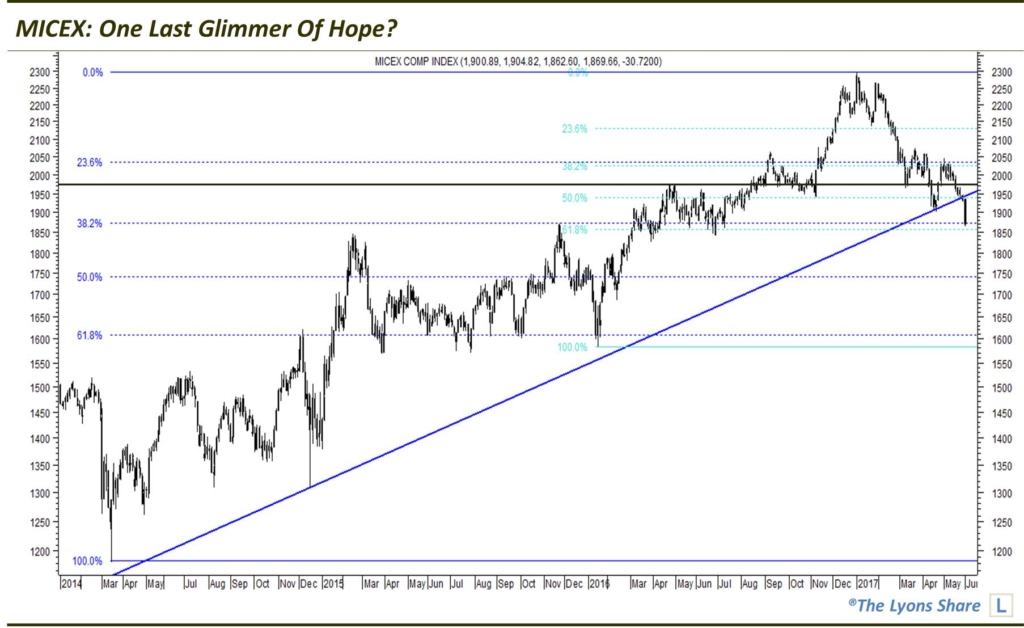
IF the MICEX can hold the level of this Fibonacci cluster near 1860, and rebound above the breakdown level near 1970, it can turn the tables and create a false breakdown. Achieving that would set the stage for a potential new leg higher in the Russian market — potentially MUCH higher. First things first, though. This Fibonacci cluster must hold and propel the index above its breakdown area. Until that happens, we have to consider the breakdown to be the overriding influence, and the path of least resistance, down with the next serious support not coming until near the 1600 level.
It is important to remember, though, that this index is priced in rubles. So unless U.S. and other investors want to hedge their Russian equity exposure with rubles, their investment performance won’t necessarily track the MICEX. Another Russian stock index that is priced in U.S. dollars is the Russian Trading System Index (RTSI). The RTSI may give U.S. investors a clearer idea of the investment results of buying Russian stock exposure here.
So what does the RTSI look like? It is, of course, a bit different than the MICEX, but its current proximity is about as interesting.
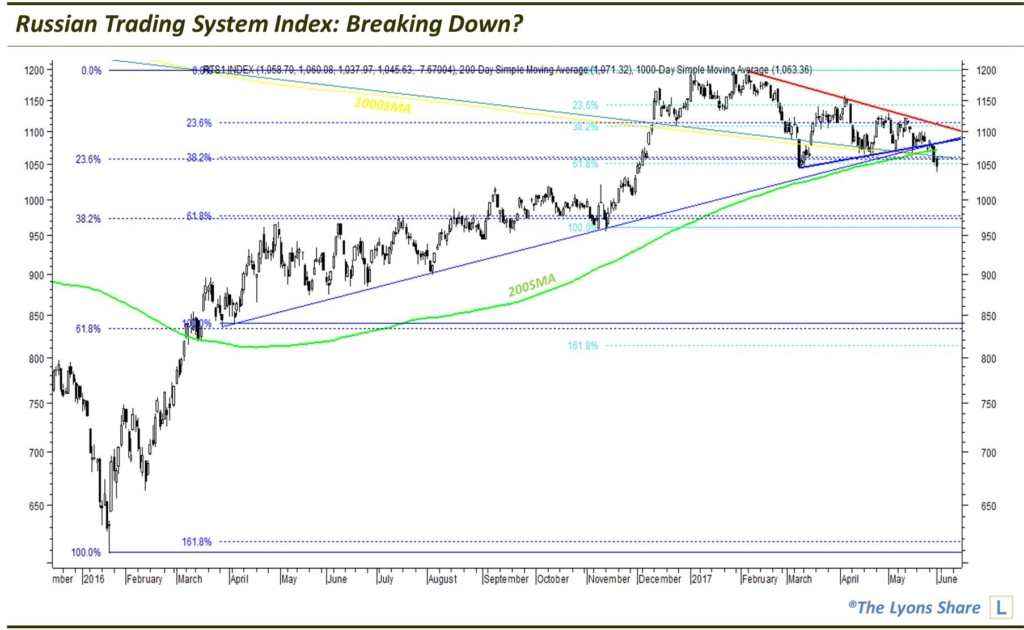
Currently, the RTSI is threatening to break down out of a tight, recent pennant formation. The bottom of the pennant is aligned with a plethora of key chart levels, including:
- the 23.6% Fibonacci Retracement of the Jan 2016-2017 rally
- the 38.2% Fibonacci Retracement of the Mar 2016-2017 rally
- the 61.8% Fibonacci Retracement of the Nov-Feb rally
- the 200-Day Moving Average
- the 200-Week Moving Average
- the Post-2012 Down Trendline, on a log scale
So you can see that this potential breakdown is arguably as significant as that of the MICEX. Thus, if the RTSI cannot quickly recover the breakdown level near 1070, the breakdown looks serious and should lead to further immediate downside, with the next potential significant support near the 975 level.
How can investors get exposure? The most popular U.S.-based Russian stock ETF is the Market Vectors Russia ETF, ticker, RSX. Fortunately, the RSX tracks the RTSI very closely. Thus, it too has potentially broken down below some significant support levels, including the bottom trendline of its recent pennant as well as the 200-Day and 200-Week Moving Averages. However, for now, it is holding its key Fibonacci Retracement cluster near 19.50-19.70.
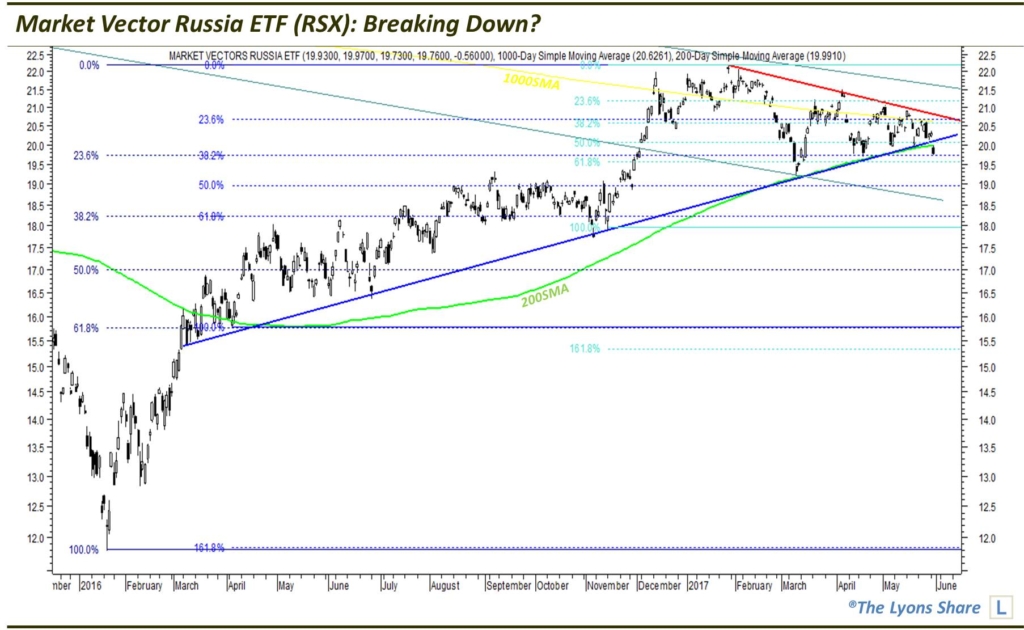
For a favorable long position, the RSX must hold this Fibonacci level near 19.50 AND recover the broken support at the 20.00 level. If it can, then a false breakdown may be in order and substantial upside is possible. Failing to do so, however, leaves the downside more likely, with the next support coming in closer to the 18.25 level.
Lastly, there is one more Russian ETF that has been on our radar for some time. It is the Market Vectors Russia Small-Cap ETF, ticker, RSXJ. While the RSXJ got hit much harder during the prior bear market, it has also rebounded more strongly since the early 2016 low. Furthermore, it is holding up much better at the moment than the larger-cap RSX.
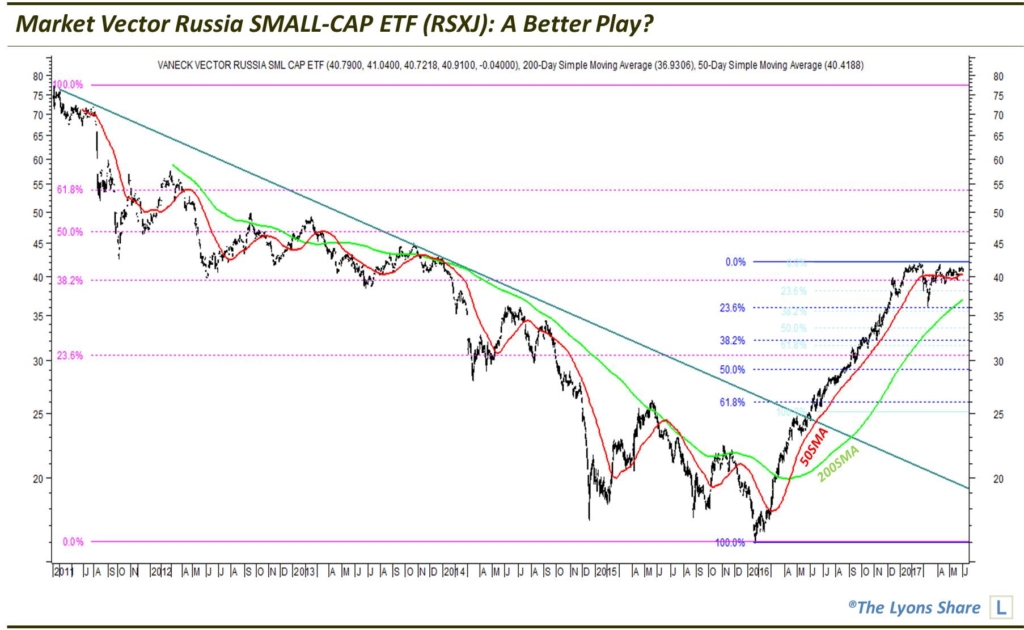
The tight, high consolidation in the RSXJ is suggestive of a continuation pattern, i.e., it should eventually resolve higher. The fact that the small-caps have held up well also leads us to believe that things aren’t too bad off in the Russian equity market, in general. If that is the case, look for the breakdowns laid out above to be reversed and turned into “false” breakdowns. Of course, we cannot anticipate that development. But we can be on the lookout for it in case it unfolds.
_____________
Disclaimer: JLFMI’s actual investment decisions are based on our proprietary models. The conclusions based on the study in this letter may or may not be consistent with JLFMI’s actual investment posture at any given time. Additionally, the commentary provided here is for informational purposes only and should not be taken as a recommendation to invest in any specific securities or according to any specific methodologies. Proper due diligence should be performed before investing in any investment vehicle. There is a risk of loss involved in all investments.