
Is Chart Of AT&T Calling For A Bottom?
The stock of AT&T just dropped to a 52-week low — but may be hitting significant support levels as well.
As advocates of relative strength, we target strong-performing areas of the market when selecting long positions. The trend is your friend as they say, and it is much more forgiving to buy a stock or fund in an uptrend than one heading south. For that reason, stocks hitting 52-week lows typically would not be on our radar. That is, unless they are hitting levels of potential major significance. That may be the case presently with the stock of AT&T (T).
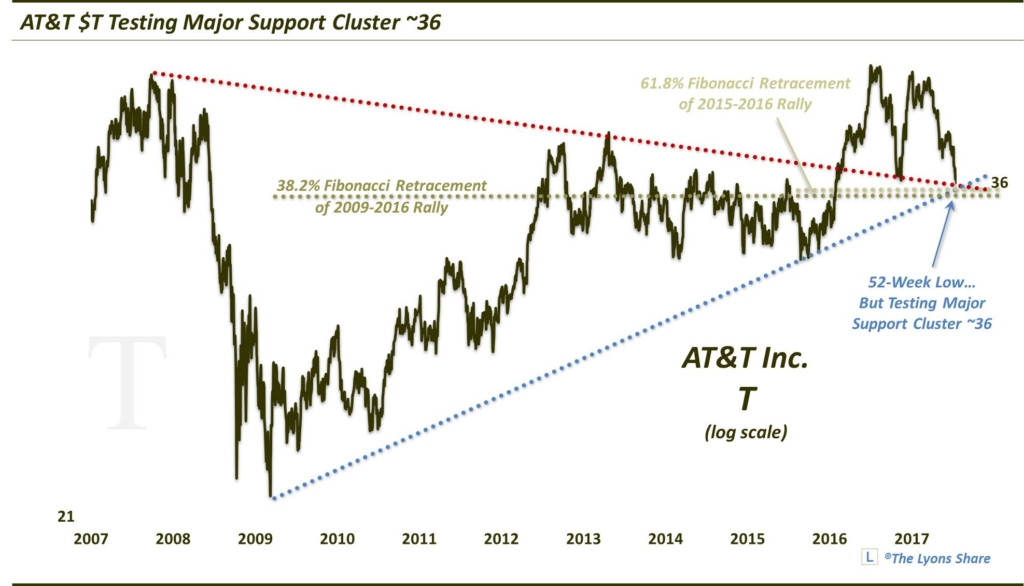
Yesterday (July 18), T dropped to a 52-week low for the first time since the selloff of August 2015, closing at 35.99. While that is not welcomed news for AT&T investors, the move has brought the stock to a confluence of potentially meaningful support levels, including:
- The broken post-2007 Down trendline ~36
- The post-2009 Up trendline~35.50
- 38.2% Fibonacci Retracement of 2009-2016 Rally ~35.40
- 61.8% Fibonacci Retracement of 2015-2016 Rally ~36.00
- 1000-Day (~200-Week) Simple Moving Average ~36.30
So, will this 35.50-36 level hold in AT&T? There is no guarantee. Momentum can be a powerful force and as long as the stock is making lower highs and lower lows, the benefit of the doubt is to the downside. That is why we prefer a relative strength approach that has us buying uptrends.
In the case of T, it could reasonably be argued that the stock is, in fact, in a longer-term uptrend, still posting higher lows since the 2008 bottom. That perhaps makes it a bit easier to stick one’s neck out and buy into the present weakness. Regardless of the longer-term trend, the plethora of meaningful potential support levels clustered around the 36 area on the chart should at least dial up a short-term bounce in the stock of AT&T.
Follow along the progress of this potential trade in AT&T in our daily member videos at The Lyons Share. Thanks for reading!
_____________
Disclaimer: JLFMI’s actual investment decisions are based on our proprietary models. The conclusions based on the study in this letter may or may not be consistent with JLFMI’s actual investment posture at any given time. Additionally, the commentary provided here is for informational purposes only and should not be taken as a recommendation to invest in any specific securities or according to any specific methodologies. Proper due diligence should be performed before investing in any investment vehicle. There is a risk of loss involved in all investments.