
Active Managers Throw Caution To The Wind (PREMIUM-UNLOCKED)
This is a free look at the type of research and analysis we highlight for Premium Members every day at The Lyons Share
A survey of active investment managers is presently showing the highest level of equity exposure on record.
As the end of the year approaches, the question on everyone’s mind on Wall Street is will the famed Santa Claus Rally show up this year? Given the fact that the stock market has managed to bypass adversity in 2017 about as well as any year in history, we’d be hard-pressed to bet against the year-end rally. Another group of investors feels that way as well and is putting their money where their mouth is — big time.
The National Association of Active Investment Managers, or NAAIM, is made up of Registered Investment Advisors and other money managers who employ active or tactical investment strategies as opposed to buy-&-hold and passive asset allocation. For the most part, the goal of such strategies is to reduce investment risk by applying processes to mitigate losses when they view markets as high-risk. Apparently, this group sees very little risk in the market at this time — or else they see Santa’s sleigh headed this way — because they’re currently throwing all caution to the wind.
That interpretation is according to the NAAIM Exposure Index, a survey of the group’s collective equity allocation. Based on the latest reading of the Index, these active managers have an average of 109% exposure to the stock market. Yes, 109%, meaning the average manager is leveraged long. That is the highest reading in the survey’s 11-year history, and the 12th reading over 100%.
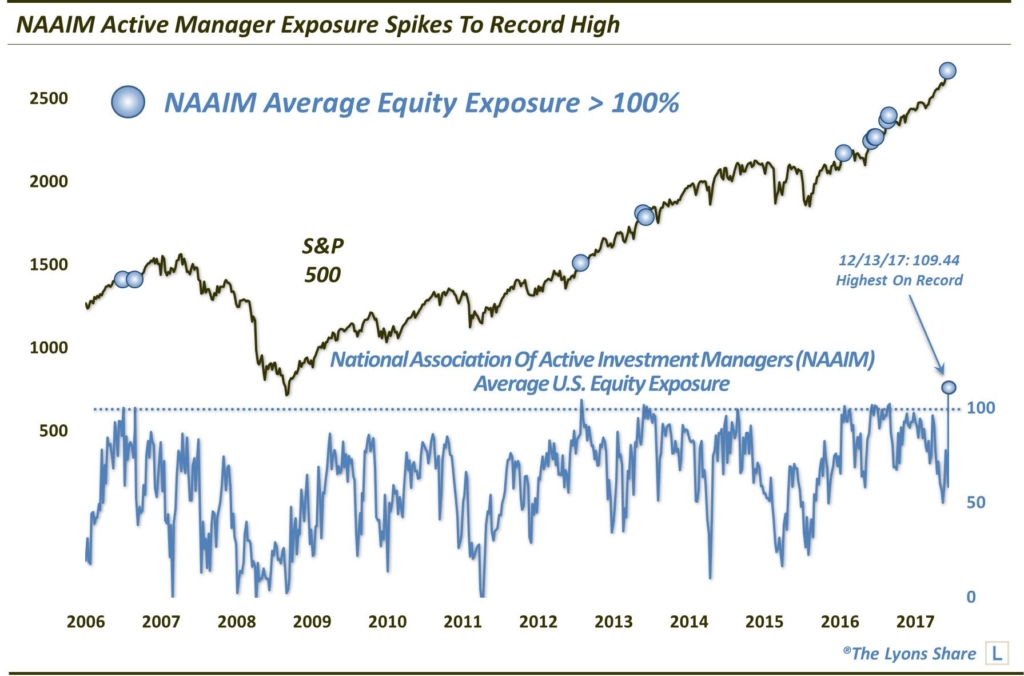
At face value, the obvious concern here, from a contrarian perspective, is the extremity of bullishness. That is, once collective investment opinion or posture becomes too one-sided, it can be an indication that market action may be necessary to correct such consensus, regardless of the investment acumen of the investors in question.
We include that point regarding acumen as we have high regard for NAAIM members. As we have mentioned before, our RIA firm, J. Lyons Fund Management, Inc., has been a member of NAAIM and a participating member of the NAAIM Exposure Index for many years. In fact, JLFMI’s president, John S. Lyons, was among the group’s charter members nearly 30 years ago. As such, we are quite partial to the group and its philosophy.
As testament to the acumen of NAAIM members, the contrarian “warning signal” based on bullish sentiment extremes in the Exposure Index is far from clear-cut. So before you go and sell all of your equities, consider the track record of the survey’s historical extreme bullish readings. Specifically, we are looking at historical readings on the Index of over 100% average equity exposure.
Here are those dates and subsequent performance of the S&P 500 (a few of the dates were reasonably close together, but not adjacent so we considered them as separate events).
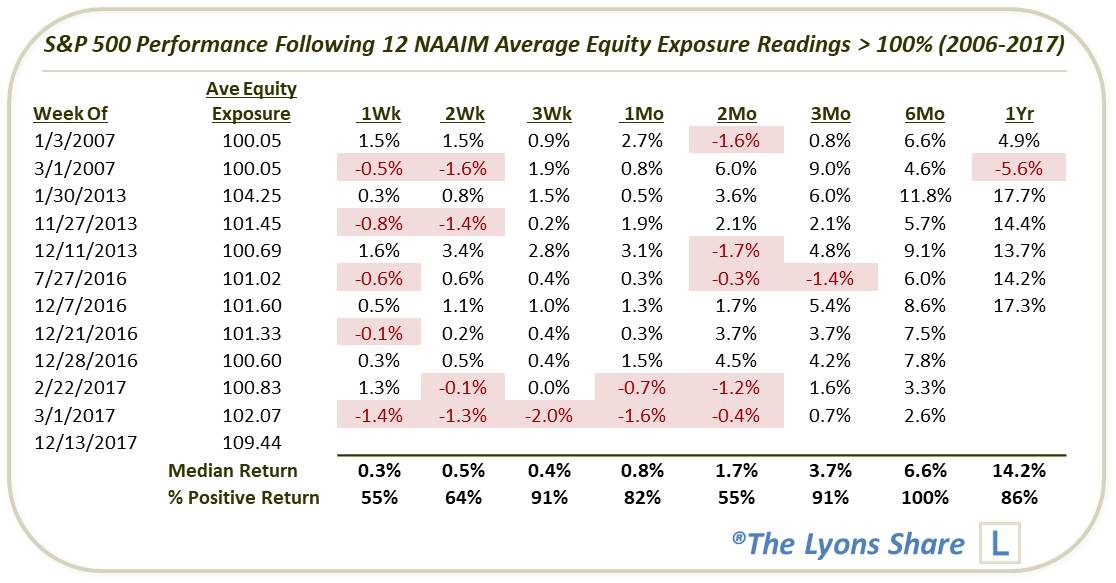
As you can see, while the first few weeks were a toss-up (a duration that short typically is), the S&P 500 was higher all but 1 time after 3 weeks and 3 months — and higher 6 months later every time. Hardly a contrarian “sell signal”.
What’s the bottom line? While historical precedents do not necessarily bear it out statistically, we would rather see skeptical sentiment from most any group, rather than consensus bullish readings. But while we would not necessarily categorize this data point as a buy signal, I think we can definitively say that an Equity Exposure reading this high is not a death knell for the rally by any means.
If you’re interested in the “all-access” version of our charts and research, please check out our new site, The Lyons Share. Considering what we believe will be a very difficult investment climate for perhaps years to come, there has never been a better time to reap the benefits of our risk-managed approach. Thanks for reading!
_____________
Disclaimer: JLFMI’s actual investment decisions are based on our proprietary models. The conclusions based on the study in this letter may or may not be consistent with JLFMI’s actual investment posture at any given time. Additionally, the commentary provided here is for informational purposes only and should not be taken as a recommendation to invest in any specific securities or according to any specific methodologies. Proper due diligence should be performed before investing in any investment vehicle. There is a risk of loss involved in all investments.


17 Comments