
Long-Term Rates Threatening Regime Change?
The yield on the 30-Year U.S. Treasury Bond is (again) threatening to break out of its ultra low-rate environment.
Among the most important developments in a busy few weeks in the financial markets has been the rise (and breakout, in some cases) in bond yields. For example, the yield on the 10-Year U.S. Treasury Note (TNX) recently broke above its highs of a year ago and is now testing levels not seen in about 4 years. And as today’s Chart Of The Day reveals, the 30-Year yield (TYX) is testing a potentially consequential level of its own.
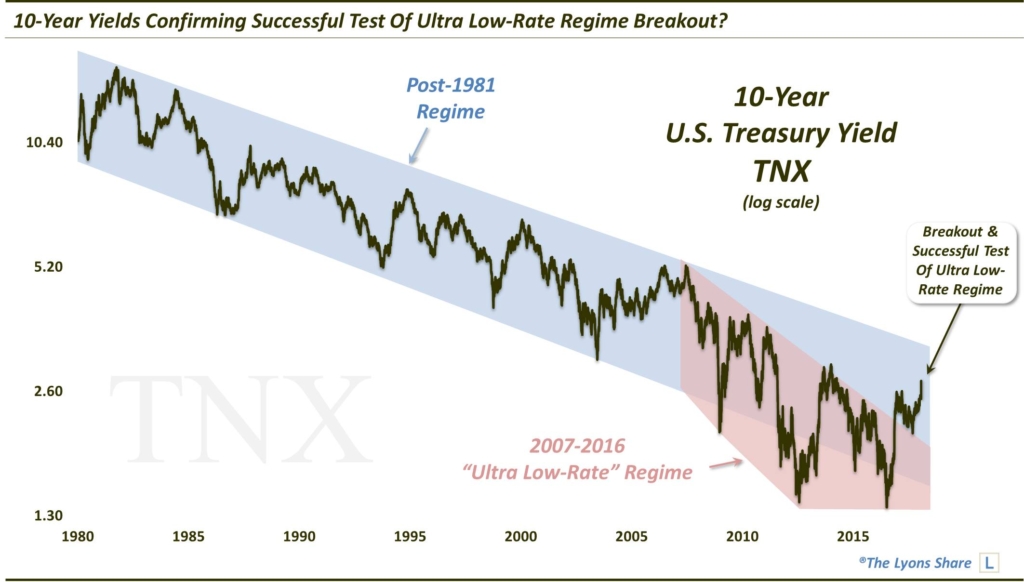
Speaking of a year ago, it was about this time last year that we pointed out the notable potential development occurring as a result of the upward action in the TNX. At that time, we introduced the notion of a “regime change” in the bond market. Specifically, we argued that the TNX was possibly emerging from the nearly decade-long “extraordinarily, or ultra, low-rate regime”.
Put simply, the TNX at the time was threatening to break above the Down trendline that had confined it to those ultra-low levels since the peak in 2007. It wasn’t not necessarily that the long-term downtrend in yields that began in the early-1980’s was ending — just the steeper ultra low-rate regime that characterized yields during the financial crisis and its aftermath. If the multi-decade downtrend in rates was to end, however, this signified the first, necessary step.
The TNX did indeed break the post-2007 ultra low-rate, regime-defining line. And as the updated chart below reveals, after several months of successfully testing that line in 2017, we now find the 10-Year yield breaking out to multi-year highs — and possibly on its way to test the post-1981, loooong-term Down trendline (currently ~3.45%).
Finally, after much reluctance, the 30-Year yield is joining the TNX in its ascent. And as the Chart Of The Day below shows, the TYX is now testing its own regime-defining line — the Down trendline from its 2011 top (currently around 3.05%).
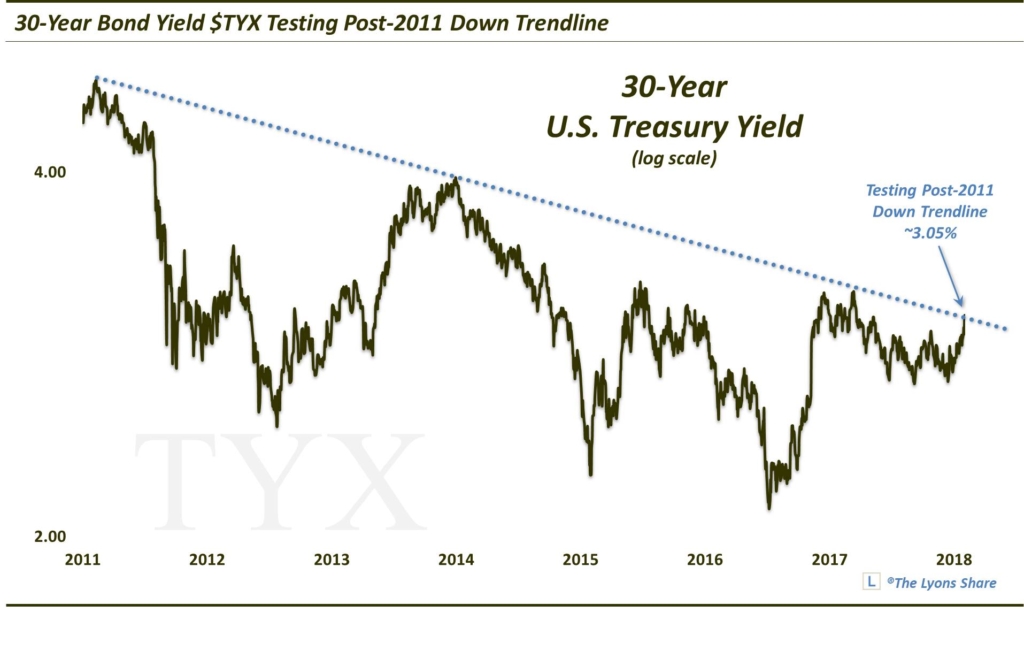
Will this line break — and officially break the 30-Year yield out of its own ultra low-rate environment? Eventually, yes, though, whether or not it’s on this attempt remains to be seen. If it does breakout, what is the next upside target? As with the $TNX, likely it will be the upper trendline that has been constraining the TYX since the early 1980’s, currently close to the 4% level.
As always, we will keep The Lyons Share members informed of critical levels on the TYX and TNX — and all of the major markets — on a daily basis in our Daily Strategy videos as well as other Premium Posts. If you are interested in the Premium version of our charts and research, check out our “all-access” service, The Lyons Share. You can follow our investment process and posture every day — including insights into what we’re looking to buy and sell and when. Thanks for reading!
_____________
Disclaimer: JLFMI’s actual investment decisions are based on our proprietary models. The conclusions based on the study in this letter may or may not be consistent with JLFMI’s actual investment posture at any given time. Additionally, the commentary provided here is for informational purposes only and should not be taken as a recommendation to invest in any specific securities or according to any specific methodologies. Proper due diligence should be performed before investing in any investment vehicle. There is a risk of loss involved in all investments.